- IBM SPSS Statistics: User-friendly with a point-and-click interface, ideal for academic and small research teams. Pricing starts at $99/year, but it’s better for medium-sized datasets.
- SAS: Perfect for large organizations handling massive datasets. Known for enterprise-level reliability and advanced analytics, though it has a steep learning curve and high costs starting at $1,500/user.
- R Programming: A free, open-source option favored by data scientists. Highly flexible with over 18,000 packages but requires coding skills and struggles with very large datasets.
Quick Comparison
| Feature | IBM SPSS Statistics | SAS | R Programming |
|---|---|---|---|
| Ease of Use | Beginner-friendly | Steep learning curve | Requires coding skills |
| Cost | $99–$449/year | $1,500+/user | Free (open-source) |
| Data Handling | Medium-sized datasets | Massive datasets | Limited by memory |
| Customization | Limited | Moderate | Highly customizable |
| Popular Use | Academic research | Enterprise, government | Data science, research |
Summary
Choose SPSS for ease of use, SAS for enterprise-level projects, or R for cost-effective flexibility. Test free trials to find the best fit for your needs.
Multivariate Analysis of Variance (MANOVA) in SPSS Tutorial (SPSS Tutorial Video #22) - GLM
Important Features in Multivariate Analysis Software
When working with complex, multivariate datasets, having the right software can make all the difference. The right tools can save you from endless manual calculations and help you uncover valuable insights. Below are some key features to consider when evaluating multivariate analysis software.
Statistical Analysis Tools
To handle multifaceted data effectively, your software needs a solid set of statistical tools. Features like Principal Component Analysis (PCA) for simplifying data complexity and Linear Discriminant Analysis (LDA) for improving classification accuracy are must-haves.
Other essential methods include MANOVA (Multivariate Analysis of Variance), factor analysis, cluster analysis, multiple linear regression, and multiple logistic regression. Together, these tools help you find patterns, reduce dimensionality, improve predictive accuracy, and explore relationships between variables.
Automated data preprocessing is another critical feature. By handling missing values and outliers automatically, the software spares you hours of manual data cleaning and ensures your analysis starts on solid ground.
Charts and Reports
Analyzing data is just one part of the process - visualizing it is equally important. A good software package should include tools like scatter plots, heatmaps, and parallel coordinate graphs to help you spot trends, correlations, and outliers. These visuals make it easier to interpret complex results and communicate findings effectively to stakeholders.
Visualizations can also highlight details that standard models might overlook, such as unusual distributions or localized patterns. Interactive features, like the ability to explore data dynamically, are especially useful for identifying anomalies and ensuring data quality. The software should support various visualization types, including geometric, icon-based, pixel-oriented, hierarchical, and hybrid representations.
Multi-dimensional visualization tools are particularly valuable, as they allow you to explore multiple variables at once, making it easier to recognize patterns across complex datasets.
Data Integration and Processing Power
Modern multivariate analysis requires software that can handle large, complex datasets while maintaining efficiency. Seamless integration with various data sources, APIs, and database systems is a must, along with the ability to process large-scale calculations quickly and accurately. This is especially important for industries like finance, where managing massive datasets is routine.
Data import/export capabilities are also highly valued, with 90% of statistical software users rating them as important or very important.
The pharmaceutical industry offers a great example of why processing power matters. Multivariate Data Analysis (MVDA) has become a go-to method for extracting insights from large datasets, replacing older univariate approaches. Unlike univariate analysis, which examines variables individually, MVDA looks at multiple variables simultaneously to understand their interactions and combined effects. This approach transforms complex data into actionable insights, making it easier to interpret and act on findings.
Best Software for Multivariate Statistical Analysis
Here’s a look at some of the most popular software options for multivariate analysis. Each has its own strengths and potential drawbacks, so your choice will depend on your specific needs and resources.
IBM SPSS Statistics
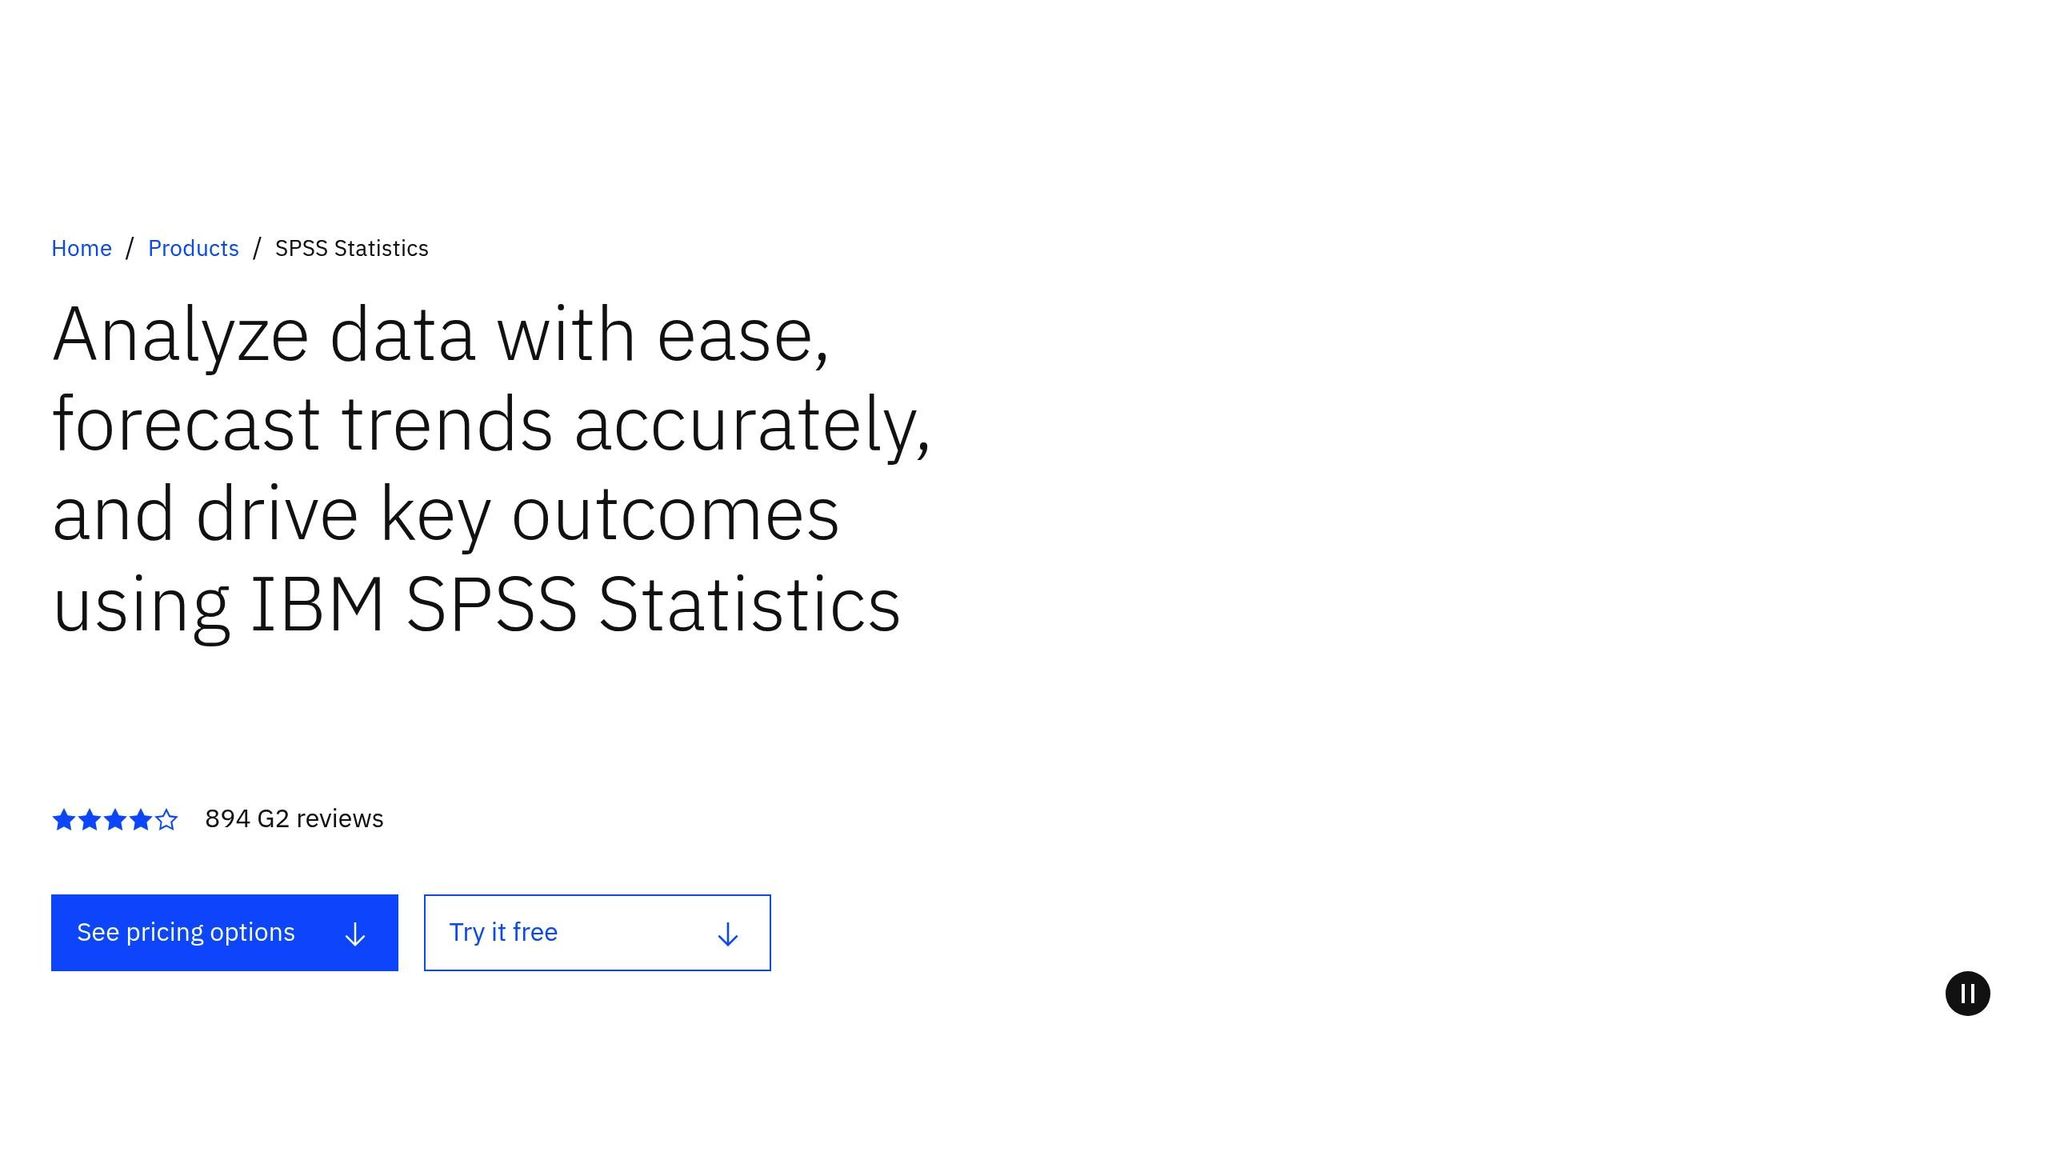
IBM SPSS Statistics is a go-to option for academic research, with more than 80% of U.S. colleges relying on this software. Its intuitive point-and-click interface makes it easy to perform even complex statistical procedures, which is why it’s so widely adopted in educational and research settings. However, the cost can be a hurdle - licenses range from $8,440 to $25,200 per user.
While SPSS handles medium-sized datasets effectively, it may fall short when working with very large datasets. If your needs extend beyond what SPSS can handle, especially for enterprise-scale projects, you might want to explore SAS as an alternative.
SAS (Statistical Analysis System)
SAS is a powerhouse for organizations managing massive datasets and prioritizing security. Known for its enterprise-level reliability, it’s a favorite among large corporations and government agencies. SAS shines in advanced time-series analysis and meets strict regulatory standards with its robust security features. It’s especially popular in fields like medicine and nursing for analyzing clinical data.
In 2023, SAS earned accolades such as "Customer's Choice" from Gartner Voice of the Customer for Analytics & Business Intelligence Platforms and the "Users Love Us" badge from G2.
That said, SAS comes with a learning curve. Its programming syntax can be challenging for beginners, and its closed system limits customization compared to open-source tools. Additionally, its graphical capabilities are often considered less dynamic than those of newer software.
R Programming Language
R is a favorite among statisticians and data scientists for its flexibility and ability to stay on the cutting edge of statistical methods. As a free, open-source platform, R eliminates licensing costs and offers unparalleled adaptability. Its Comprehensive R Archive Network (CRAN) boasts over 18,000 community-developed packages, providing tools for nearly any statistical method or industry-specific application. This extensive ecosystem has attracted a user base estimated between 250,000 and 2 million people.
Major players like Facebook, Google, Ford, and J.P. Morgan rely on R for tasks ranging from social network analysis to forecasting. It’s also a favorite for data visualization - The New York Times uses R to create engaging charts and graphs for its stories. The widely-used ggplot2 package, in particular, is celebrated for its ability to produce visually appealing and interactive graphics.
However, R does have its challenges. It struggles with memory limitations when handling very large datasets, and its reliance on coding can make it intimidating for those without programming experience. Still, R’s ability to integrate with languages like Python, C++, and Java adds to its versatility, making it a strong choice for organizations seeking flexibility and cutting-edge tools for statistical analysis.
sbb-itb-2e26d5a
Software Comparison
When it comes to multivariate analysis, the choice of software often hinges on factors like ease of use, cost, and scalability. The three major players in this space - IBM SPSS Statistics, SAS, and R Programming - each bring their own strengths and limitations to the table. Picking the right one depends on your specific needs, budget, and technical expertise.
Side-by-Side Comparison
| Feature | IBM SPSS Statistics | SAS | R Programming |
|---|---|---|---|
| Ease of Use | Intuitive point-and-click interface; beginner-friendly | Requires programming skills; steeper learning curve | Programming knowledge essential; challenging for non-coders |
| Cost | $99–$449 per user per year | Pricing starts around $1,500 per user and can escalate to millions for full implementations | Free (open-source) |
| Statistical Features | Data management, visualization, descriptive statistics, linear regression | ANOVA, Bayesian analysis, cluster analysis, survival analysis, and more | PCA, factor analysis, cluster analysis, discriminant analysis, and canonical correlation analysis |
| Data Handling | Best for medium-sized datasets | Scales well for massive datasets | May struggle with very large datasets due to memory limits |
| Customization | Limited; operates as a closed system | Comprehensive but still a closed system | Highly customizable with extensive packages available |
| Industry Adoption | Used by 80% of U.S. colleges | Popular in enterprise and government sectors | Trusted by companies like Facebook, Google, Ford, and J.P. Morgan |
| Support & Learning | Detailed documentation; discounts for educational use | Enterprise-grade support | Community-driven support with a wealth of online resources |
| Integration | Compatible with R and Python | Integrates with enterprise systems and databases | Works with Python, C++, and Java |
The table offers a clear snapshot of how these tools compare, but let’s unpack their strengths and challenges in more depth.
IBM SPSS Statistics stands out for its user-friendly interface, making it ideal for beginners or those who prefer not to code. It’s great for advanced analyses without requiring programming skills. However, its pricing can be a barrier for smaller organizations or users in developing countries.
SAS, on the other hand, is a powerhouse for enterprise environments. Its scalability and extensive statistical capabilities make it a go-to for large-scale projects, particularly in industries that demand robust analytics. That said, the financial commitment is significant, with costs that can climb steeply depending on the implementation.
R Programming takes the crown for flexibility and cost-effectiveness. As an open-source tool, it eliminates licensing fees, which is a big win for budget-conscious teams. Its vast library of packages makes it highly adaptable, but users often note that its performance can lag with very large datasets. Additionally, the steep learning curve can be a hurdle for those without programming experience.
Ultimately, many organizations find that no single tool meets all their needs. Instead, they often use a combination of these platforms, leveraging the unique advantages of each to tackle specific projects. This approach allows teams to balance cost, usability, and analytical power, ensuring they have the right tool for every job.
Final Thoughts
Choosing the right multivariate software depends on what you're aiming to achieve, your level of expertise, and how much you’re willing to spend. When comparing IBM SPSS Statistics, SAS, and R Programming, it’s clear that each platform shines in different areas.
User reviews highlight strong features like reporting, visualization, and data handling capabilities. Cost is a major differentiator - R stands out as a free option, while SPSS and SAS bring structured support and user-friendly designs that may justify their price tags. Entry-level plans for most statistical software range from $19 to $125 per month, but enterprise solutions can cost significantly more. The learning curve also varies: SPSS is beginner-friendly and great for those without programming skills, while R offers unmatched flexibility but requires more technical knowledge. SAS lands in the middle, balancing enterprise-grade features with moderate complexity.
Our Recommendations
When deciding, think about what matters most to you - features, cost, or ease of use. Here’s how these tools stack up:
- IBM SPSS Statistics: A great option for academic institutions and small research teams, provided the budget allows. With an 8/10 user rating and adoption by over 80% of U.S. colleges, it’s perfect for survey studies and market research.
- SAS: Best suited for large organizations managing extensive datasets. Its ability to scale and integrate with enterprise systems makes it worth the higher price for complex analytics projects.
- R Programming: Ideal for budget-conscious researchers who don’t mind rolling up their sleeves. Its vast library of packages and active community support make it a powerhouse for advanced research, though it requires time to learn and navigate.
Before committing, take advantage of free trials to test performance and evaluate whether you’ll need technical assistance. Don’t forget to consider all costs - licensing, subscriptions, updates, and support. Training expenses are also crucial, as proper education can make or break the effectiveness of your chosen software.
FAQs
What should I consider when choosing between IBM SPSS, SAS, and R for multivariate statistical analysis?
When choosing between IBM SPSS, SAS, and R for multivariate statistical analysis, it's essential to weigh factors like usability, customization options, and budget. Here's a quick breakdown:
- SPSS: Known for its user-friendly interface, SPSS is a great option for beginners. Its straightforward design makes it easy to navigate, even for those with limited statistical knowledge.
- SAS: If you're working with massive datasets, SAS is a powerhouse. However, mastering it takes time due to its more complex interface and advanced features.
- R: As an open-source tool, R offers unparalleled flexibility and customization. It's perfect for those who need tailored solutions, though it comes with a steeper learning curve.
When it comes to cost, R is free, making it an excellent choice for individuals or smaller teams with limited budgets. On the other hand, both SPSS and SAS require paid licenses, which can be expensive but include dedicated support services. R, while free, has a large and active online community that can be incredibly helpful for troubleshooting.
Ultimately, your decision should reflect your technical skills, the complexity of your analysis, and how much you're willing to spend. Each tool has its strengths, so pick the one that best fits your specific needs.
How do IBM SPSS, SAS, and R compare in visualizing complex datasets for multivariate analysis?
IBM SPSS offers intuitive tools for creating clear, visually appealing charts and graphs, making it a go-to option for interpreting multivariate data. With features like regression analysis and MANOVA, it simplifies the process of visualizing complex relationships, delivering professional and straightforward outputs.
SAS shines when it comes to dynamic visualization, offering multidimensional graphs and interactive visualizations. Its Visual Statistics feature lets users explore large datasets with ease, making it a strong choice for those who need detailed and interactive insights.
R, on the other hand, is celebrated for its flexibility and advanced customization options. With libraries like ggplot2 and lattice, users can design intricate and highly tailored visualizations to highlight relationships across multiple variables. While R demands a higher level of technical skill, it’s the top choice for handling complex and specific visualization tasks.
SPSS and SAS prioritize simplicity and standard visualizations, while R stands out for its ability to deliver advanced, fully customized plots.
What challenges might arise when using R for analyzing very large datasets in multivariate statistics?
R can face a few hurdles when tackling very large datasets in multivariate analysis. One major challenge is memory usage. Since R processes data in memory, if your dataset exceeds your computer’s available RAM, you might experience significant slowdowns or even crashes. Another issue is performance. Unlike some tools like Python, R is single-threaded, which can make it slower when working with massive datasets. On top of that, handling data complexity - like addressing missing values, multicollinearity, or reducing dimensions - often demands a lot of preprocessing. This can make the overall workflow more time-intensive and complicated.