Predicting earnings surprises can give you a major edge in stock trading. Tools like Zacks Earnings ESP, FactSet Earnings Insight, Earnings Whispers Power Rating, and MarketBeat Earnings Tools each offer unique ways to analyze data and anticipate how stocks might react to quarterly results. Here's a quick rundown:
- Zacks Earnings ESP: Focuses on recent analyst revisions to predict surprises, with a 70% success rate for positive outcomes when combined with top Zacks Ranks. Best for short-term trades.
- FactSet Earnings Insight: Uses deep analyst data and historical trends to refine predictions. Ideal for data-heavy strategies but may feel complex for casual users.
- Earnings Whispers Power Rating: Quantifies the size of earnings surprises, helping traders spot short-term opportunities. Best for active traders targeting post-earnings momentum.
- MarketBeat Earnings Tools: Combines analyst forecasts and company guidance in a simple format. Great for quick insights but lacks advanced analytics.
Quick Comparison:
| Tool | Focus Area | Key Strength | Limitations |
|---|---|---|---|
| Zacks Earnings ESP | Analyst revisions | 70% success rate | Limited for long-term strategies |
| FactSet Earnings Insight | Analyst data, trends | Detailed predictions | Complex interface |
| Earnings Whispers Power Rating | Post-earnings momentum | Short-term trading focus | Crowd-sourced data variability |
| MarketBeat Earnings Tools | Forecasts, guidance | Easy-to-use interface | Lacks advanced analytics |
If you're a trader, these tools can help you anticipate market moves and make informed decisions. Combining them may provide a broader perspective, but no tool is foolproof - market surprises can always happen.
How to Use the Zacks Earnings ESP (Expected Surprise Prediction) Filter

1. Zacks Earnings ESP
Zacks Earnings ESP stands out as a tool designed to predict earnings surprises by leveraging recent data and analyst revisions. The system zeroes in on companies where updated analyst estimates suggest a higher chance of exceeding earnings expectations.
Prediction Methodology
The core idea behind the Earnings ESP methodology is straightforward: recent information is often more reliable than older data. To calculate the ESP, Zacks compares two figures - the "Most Accurate Estimate" and the "Zacks Consensus Estimate." The percentage difference between these two numbers reveals the expected surprise.
Accuracy and Reliability
Over a decade of backtesting, stocks with a positive Earnings ESP paired with a Zacks Rank of #1, #2, or #3 delivered positive surprises 70% of the time. Kevin Matras from Zacks explains:
"While nothing is 100%, our tested over a decade, the Earnings ESP achieves 70% accuracy in predicting which stocks will positively surprise."
For investors holding these stocks for just one week around earnings announcements, the average annual return reached 28.3% over the past ten years. Stocks with an ESP greater than 3% performed even better, achieving an average annual return of 37.2%. These results make the ESP system a valuable resource for active traders.
Key Features
The ESP tool is fully integrated into Zacks' research platform, allowing investors to screen stocks daily with ease. By combining ESP data with Zacks Rank ratings, users can apply a dual-filter approach that significantly improves success rates.
Another highlight is the tool’s ability to update ESP figures daily. As analysts revise their estimates, the system recalculates the ESP, keeping investors informed right up to the earnings announcement.
Strengths and Weaknesses
While the ESP system excels at identifying positive surprises, it has its limitations. It is far more effective at predicting which stocks will exceed expectations than it is at forecasting misses. In fact, a positive ESP is a much stronger indicator of a positive surprise than a negative ESP is for a negative one.
To maximize the tool’s potential, it’s crucial to pair positive ESP readings with strong Zacks Ranks (#1-3). Additionally, the ESP is most effective for short-term strategies, particularly with one-week holding periods around earnings announcements. This makes it ideal for tactical trading but less suited for long-term investment strategies, requiring active portfolio management to achieve optimal results.
2. FactSet Earnings Insight
FactSet Earnings Insight stands out by going beyond just consensus estimates. It dives deep into multiple layers of analyst data, using a detailed approach to predict earnings surprises. By tapping into its vast database of earnings estimates, the platform analyzes analyst behavior, company-specific patterns, and market trends to create more precise forecasting models.
Prediction Methodology
The platform's TrueBeats model is designed to deliver precise predictions of earnings and sales surprises. It integrates structured earnings data with analyst profiles - focusing on factors like track record, tenure, and employer - to enhance accuracy. Each analyst's forecasts for metrics such as revenue, EPS, cash flow, dividends, and same-store sales are carefully evaluated. FactSet also monitors trends in earnings beats and misses for individual stocks and their peer groups. Peer groups are defined through overlapping analyst coverage, timing of announcements, management guidance, and variations in estimates. This multi-faceted approach ensures predictions are both detailed and measurable.
Accuracy and Reliability
FactSet's methodology has proven to improve prediction accuracy. For example, forecasts based on an analyst's track record in sales estimation achieve a 56.6% accuracy rate, compared to 51.8% for EPS-based estimates. Additionally, research shows that an analyst's performance four quarters ago is almost twice as influential as their accuracy three quarters ago when predicting current outcomes. As of May 12, 2025, 90% of S&P 500 companies had reported Q1 earnings, with 78% surpassing estimates. Meanwhile, the Q2 bottom-up EPS estimate dropped 4.0% (from $65.55 to $62.91) between March 31 and May 29, 2025.
Key Features
FactSet comes equipped with tools to enhance its predictive capabilities:
- Consensus Figures: Compiled from a variety of analysts, these figures act as benchmarks for identifying earnings surprises.
- StreetAccount: This feature scans news sources to provide real-time updates on global markets and economies, helping users assess potential impacts on earnings.
- Peer Group Analysis: By defining peer groups based on overlapping analyst coverage, the platform offers more accurate predictions compared to traditional industry categories.
Strengths and Weaknesses
A major strength of FactSet is its ability to analyze data comprehensively, moving beyond basic averages of analyst estimates. Features like "Experts, Trends, and Management" deliver independent prediction signals that add depth to its analysis. Its consensus earnings estimates are widely followed by investors and play a crucial role in stock valuation decisions. However, despite these advantages, any inaccuracies in predictions can significantly influence market perceptions.
3. Earnings Whispers Power Rating
The Earnings Whispers Power Rating takes a unique angle by focusing on the magnitude of earnings surprises to guide short-term trading decisions. Unlike tools that merely predict whether a company will exceed or fall short of expectations, this system digs deeper, quantifying the size of those surprises and translating the data into actionable insights. The emphasis here is on capturing post-earnings price movements, particularly in the days immediately following an earnings announcement.
Prediction Methodology
This system condenses the impact of an earnings surprise into a single numerical score, making it easier to interpret. The score is specifically designed to highlight conditions that could lead to Post-Earnings Announcement Drift (PEAD) - the tendency of stock prices to continue moving in the same direction as the initial reaction to an earnings surprise. The Power Rating is particularly useful for short-term trades, typically lasting up to a week, and provides traders with a streamlined way to evaluate potential opportunities based on historical patterns.
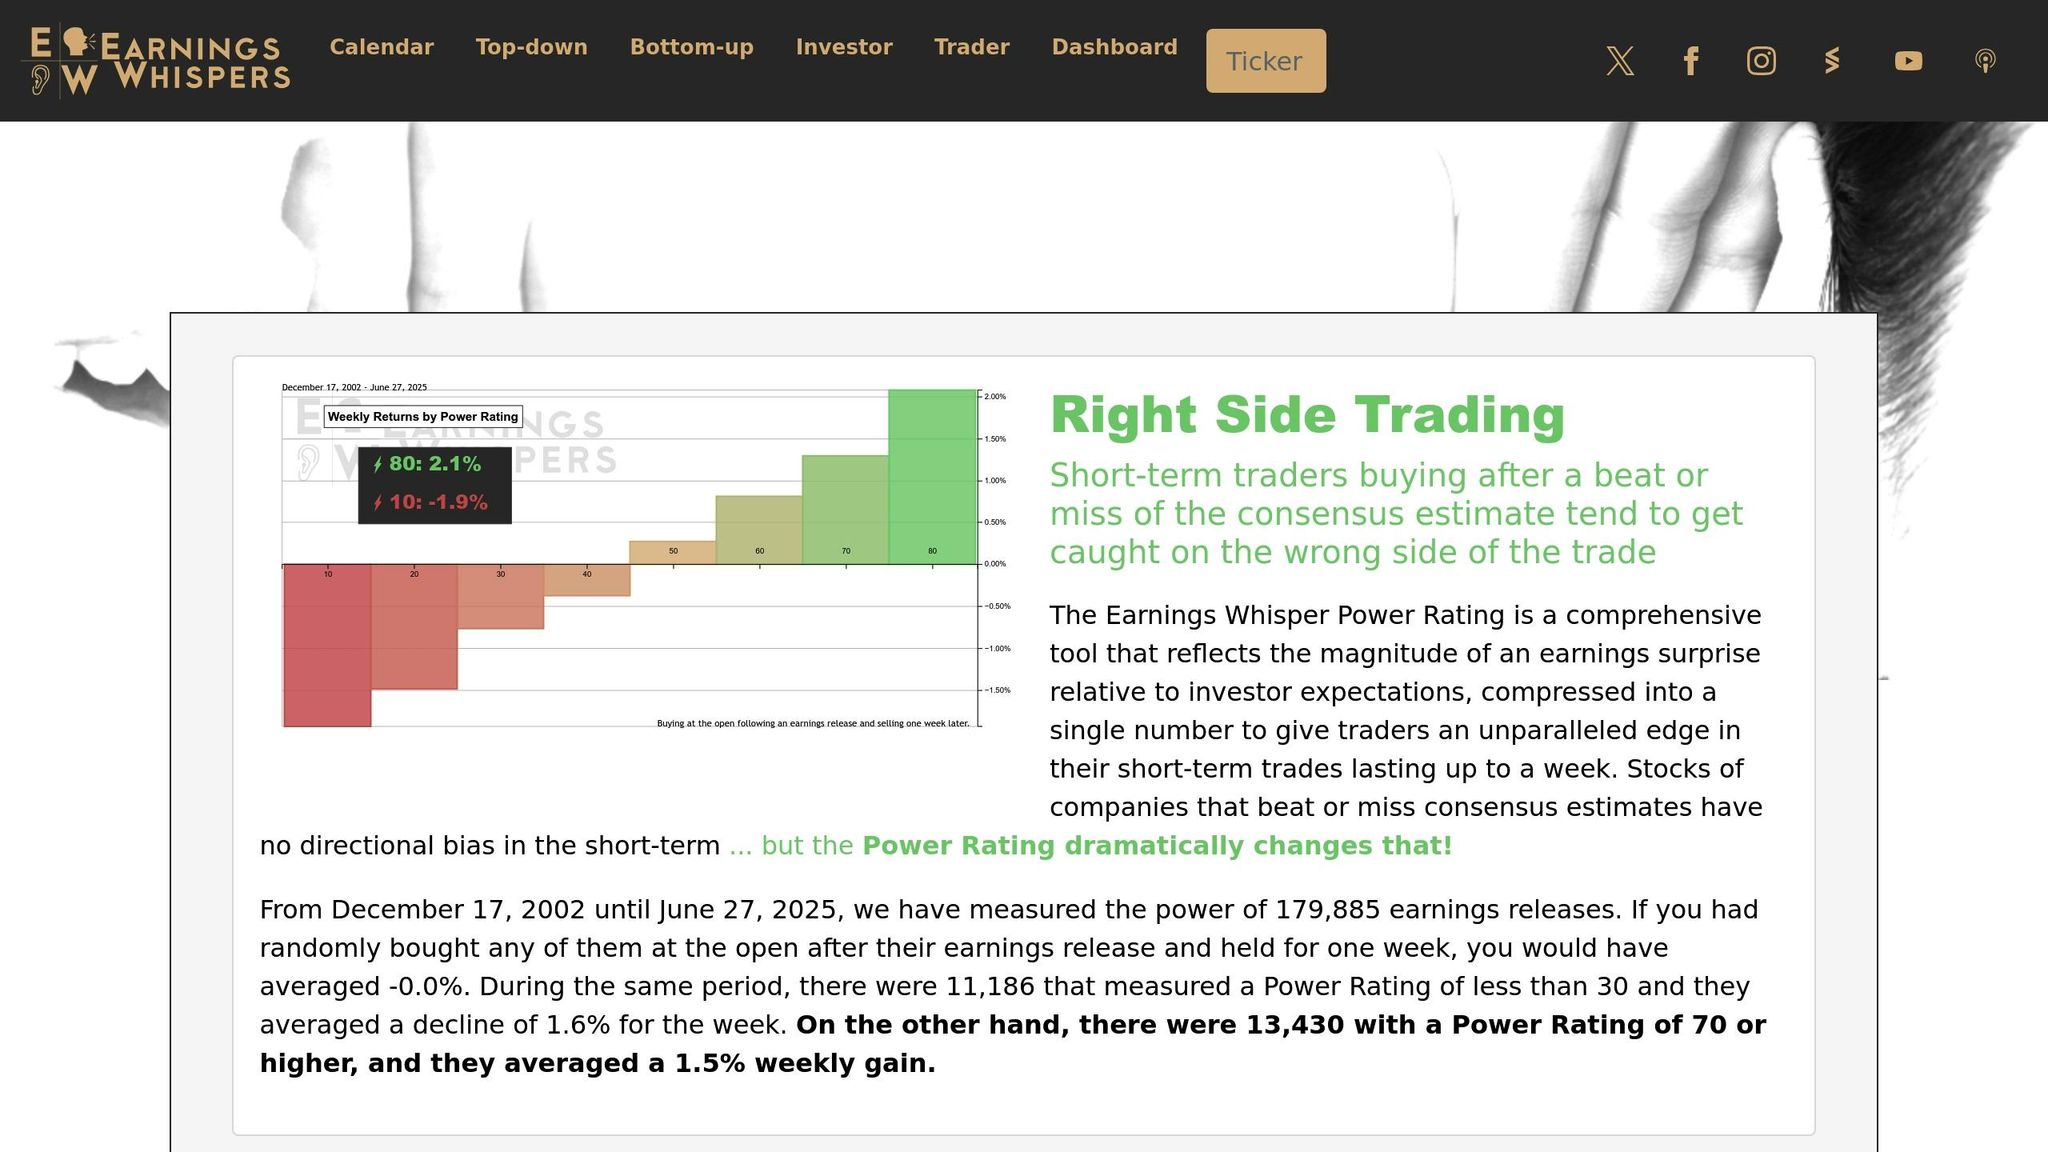
Accuracy and Reliability
The Power Rating's reliability is backed by over two decades of data, analyzing 179,885 earnings releases between December 17, 2002, and June 27, 2025. Random stock purchases over one-week holding periods showed average returns of 0.0%, but the Power Rating demonstrated clear predictive value when applied strategically.
- Stocks with a rating below 30 averaged a 1.6% decline in the week following their earnings release (based on 11,186 cases).
- Stocks with a rating of 70 or higher posted an average weekly gain of 1.5% (across 13,430 cases).
These results highlight the tool's ability to identify patterns that can be leveraged for short-term gains.
Key Features
The Power Rating system goes beyond basic earnings predictions, pinpointing gaps between actual results and market expectations.
"The Power Rating offers insight into the likely short-term strength or weakness if a stock is bought at the opening following the company's earnings release." – Earnings Whispers
By centering on significant deviations, the tool helps traders spot stocks with momentum that may persist in the days after an earnings announcement. This focus on short-term dynamics makes it a valuable resource for active traders.
Strengths and Weaknesses
One of the standout features of the Earnings Whispers Power Rating is its clear, numerical scoring system, which simplifies the process of evaluating post-earnings price movements. The tool’s extensive dataset, covering more than two decades, enhances its credibility and usefulness for short-term trading strategies. However, its narrow focus on short-term opportunities may limit its appeal to long-term investors or those with a more passive approach. Additionally, while the average movements of 1.5% to 1.6% are statistically meaningful, individual outcomes can vary, making it essential for traders to manage risk carefully.
sbb-itb-2e26d5a
4. MarketBeat Earnings Tools

MarketBeat, like other top-tier prediction tools, takes the guesswork out of analyzing earnings data by presenting it in a simplified, easy-to-digest format. By combining analyst forecasts with company guidance, it offers a clear comparison of expected versus actual earnings, helping investors make informed decisions quickly.
Prediction Methodology
The platform's methodology revolves around collecting and organizing data from analysts and company-released guidance. This dual focus ensures that users can see both external forecasts and internal expectations side by side. By keeping the presentation straightforward, MarketBeat allows investors to draw their own conclusions. Additionally, the inclusion of company guidance helps fine-tune these predictions, making the information more relevant and actionable.
Key Features
MarketBeat excels at offering a straightforward comparison of forecasted and actual earnings. By aggregating data from multiple sources, it provides a concise snapshot of how companies stack up against analysts' expectations. This clarity makes it a go-to tool for investors who want quick insights without wading through overly complex data.
Strengths and Weaknesses
One of MarketBeat's standout strengths is its ability to distill complex earnings data into a clear, aggregated view, giving investors an easy way to gauge company performance. However, its user feedback reveals mixed reviews. With a Trustpilot score of 2.8 from five reviews, complaints about spam are a recurring issue. While MarketBeat relies on traditional research methods, investors seeking cutting-edge predictive analytics might find it helpful to pair this tool with more advanced platforms for deeper insights.
Advantages and Disadvantages
After exploring each tool in detail, it's helpful to summarize their strengths and weaknesses to see how they align with different investment strategies. Each tool brings something distinct to the table, but they also have limitations. Here's a quick breakdown of their prediction methods, key strengths, and primary drawbacks.
Zacks Earnings ESP stands out when combined with a Zacks Rank of #3 or better, delivering positive earnings surprises 70% of the time and achieving an impressive 28.3% average annual return over a decade. Its reliance on recent estimate revisions offers timely insights, but it may struggle to keep up during rapid market changes due to its focus on analyst estimate updates.
FactSet Earnings Insight leverages advanced data analysis and feature engineering to identify market trends effectively. However, its complexity might make it less appealing to users looking for a straightforward interface.
Earnings Whispers Power Rating taps into crowd-sourced whisper numbers and sentiment to gauge market expectations. While this approach captures insights beyond official estimates, the reliability of crowd-sourced data can be inconsistent, especially for companies with limited analyst coverage.
MarketBeat Earnings Tools aggregates analyst forecasts and company guidance into a user-friendly format. Its simplicity is perfect for quick insights, but it lacks the advanced analytics needed to capture more nuanced market dynamics.
| Tool | Prediction Methodology | Key Strength | Main Weakness |
|---|---|---|---|
| Zacks Earnings ESP | Recent estimate revisions and analyst accuracy | 70% success rate with positive Earnings ESP | May lag during rapid market shifts |
| FactSet Earnings Insight | Comprehensive data analysis with historical trends | Sophisticated feature engineering | Complex interface could overwhelm casual users |
| Earnings Whispers Power Rating | Crowd-sourced whisper numbers and sentiment | Captures expectations beyond official estimates | Reliability of crowd-sourced data varies |
| MarketBeat Earnings Tools | Analyst forecasts and company guidance | Easy-to-read, accessible presentation | Lacks advanced analytics for deeper insights |
The effectiveness of these tools often depends on the market environment and an investor's specific strategy. Research suggests that traditional technical indicators fall short in forecasting accuracy, particularly during major market events. To address this, advanced machine learning models have started outperforming traditional methods, achieving up to 16% higher accuracy and delivering a 10% improvement in Weighted F1 scores.
Final Thoughts
After diving into the details of each tool, here are some key points to keep in mind. Picking the right earnings prediction tool can significantly influence your investment results. As we've seen, historical performance highlights the benefits of these tools, with multiple platforms showing strong returns over time.
Your investment approach should shape your choice. If you're a short-term trader, tools offering real-time updates might be your best bet. On the other hand, if you're a data-driven investor, you'll likely prefer tools with solid statistical models. The key is knowing your style and understanding how much detail you need to make confident decisions.
Many investors find that combining tools provides a broader perspective. For instance, some use Zacks ESP for initial screening to spot stocks with positive earnings surprise potential, then rely on MarketBeat for real-time updates and earnings call transcripts. This combination gives you both the numbers and the management insights to strengthen your investment thesis.
However, it’s crucial to remember that no tool is foolproof. Market conditions can shift quickly, and unexpected company-specific news can disrupt predictions. The most successful investors treat these tools as part of a larger research strategy, rather than depending on them entirely.
If you're interested in exploring more platforms or comparing features, the Best Investing Tools Directory is a helpful resource. It offers detailed reviews of various investment research platforms, trading software, and analytics tools. Whether you're an individual investor or managing institutional assets, this directory can help you find options tailored to your needs and budget.
FAQs
How do earnings prediction tools differ in usability and complexity?
Earnings prediction tools come in a wide range of options, varying in ease of use and complexity. Some are built to be simple and user-friendly, integrating effortlessly with tools like Google Sheets or Excel. These are perfect for those who want quick insights without needing to spend time learning complicated systems.
On the flip side, more advanced forecasting tools, often powered by AI, offer a deeper level of analysis and a broader range of features. However, they usually require some expertise or training to make the most of them. The best choice depends on your skill level and how detailed you need your analysis to be - basic tools focus on simplicity, while advanced ones are tailored for more complex forecasting tasks.
Can using multiple tools together improve the accuracy of predicting earnings surprises?
When it comes to predicting earnings surprises, using a mix of tools can make a big difference in accuracy. Combining approaches like analyst estimates, machine learning models, and statistical methods allows you to tap into the strengths of each while offsetting their individual shortcomings.
This strategy, known as ensemble forecasting, brings together various data sources and techniques to create more balanced and dependable predictions. For instance, blending insights from analysts with algorithm-driven models can help cut down on bias and deliver more consistent results, offering a sharper view of potential earnings surprises.
What should I look for in a tool to predict earnings surprises effectively?
When choosing a tool to predict earnings surprises, prioritize accuracy and reliability. Look into its track record - how well has it performed in the past? Also, pay attention to the methods it uses. Tools that evaluate factors like revenue growth, management effectiveness, and market positioning tend to offer insights that are more actionable.
Don’t overlook the cost either. It’s essential to find a tool that aligns with your financial goals while staying within your budget. For individual investors, the right tool should not only be affordable but also provide solid, dependable data to guide your decisions.