BookMap and TradingView are two trading platforms designed for different needs:
- BookMap: Best for day traders and scalpers needing ultra-detailed insights into market liquidity and order flow. Features include a heatmap, nanosecond zoom, and tools for tracking large orders.
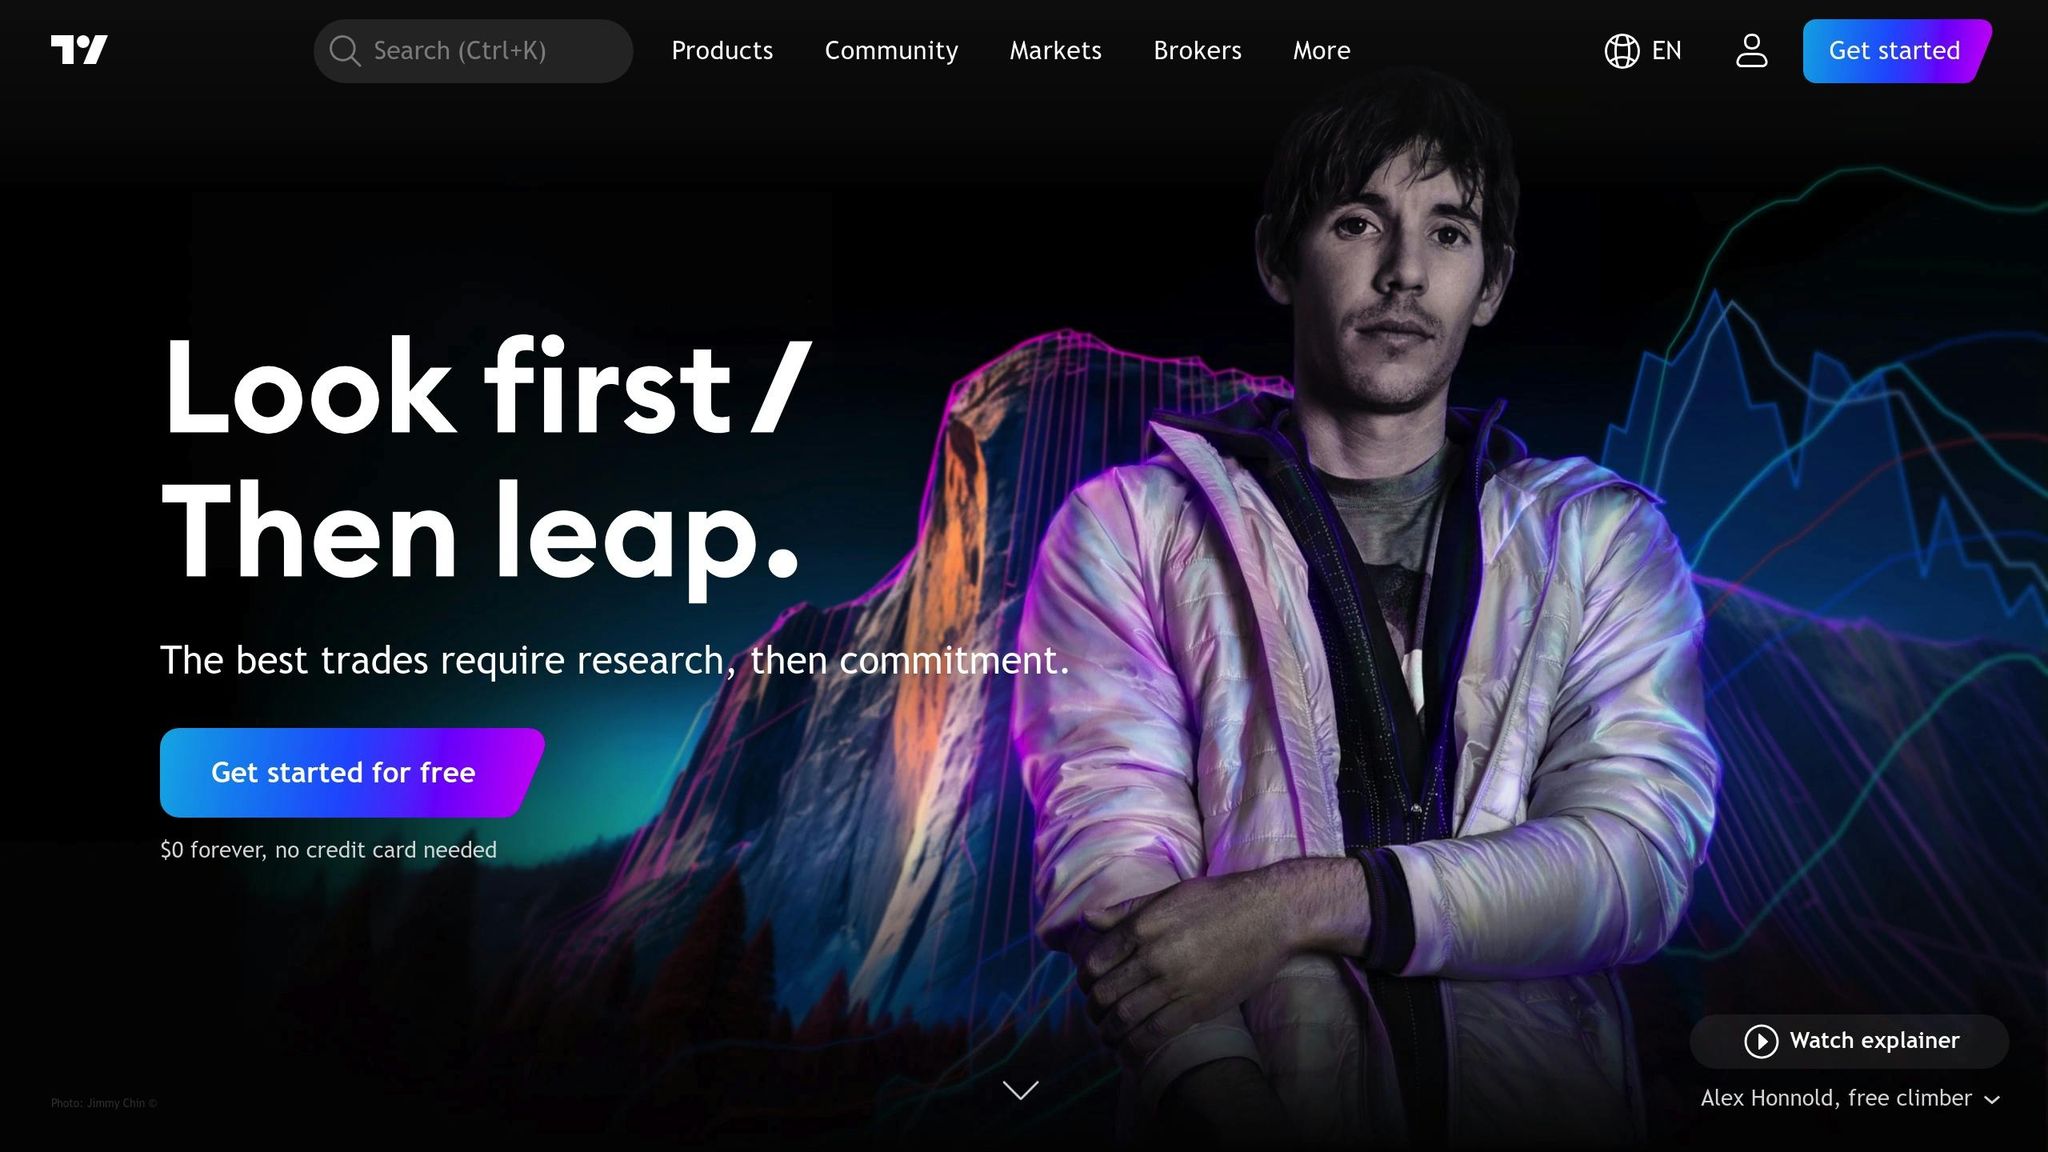
- TradingView: Ideal for traders and investors focused on technical analysis. Offers real-time charts, hundreds of indicators, customizable alerts, and a social trading community.
Quick Comparison:
| Feature | BookMap | TradingView |
|---|---|---|
| Data Refresh | ~30 milliseconds | Real-time |
| Market Visualization | Heatmap | Price charts |
| Time Frames | Nanosecond zoom | Standard intervals |
| Order Flow Tools | Yes | No |
| Technical Indicators | Limited to order flow tools | Extensive library |
| Community | Limited | Social network with 10M+ ideas |
| Pricing | Free to $79/month | Free to $59.95/month |
Choose BookMap for precision in fast-moving markets or TradingView for versatile charting and community-driven insights. For a comprehensive setup, consider using both together.
Main Features Overview
BookMap Core Tools
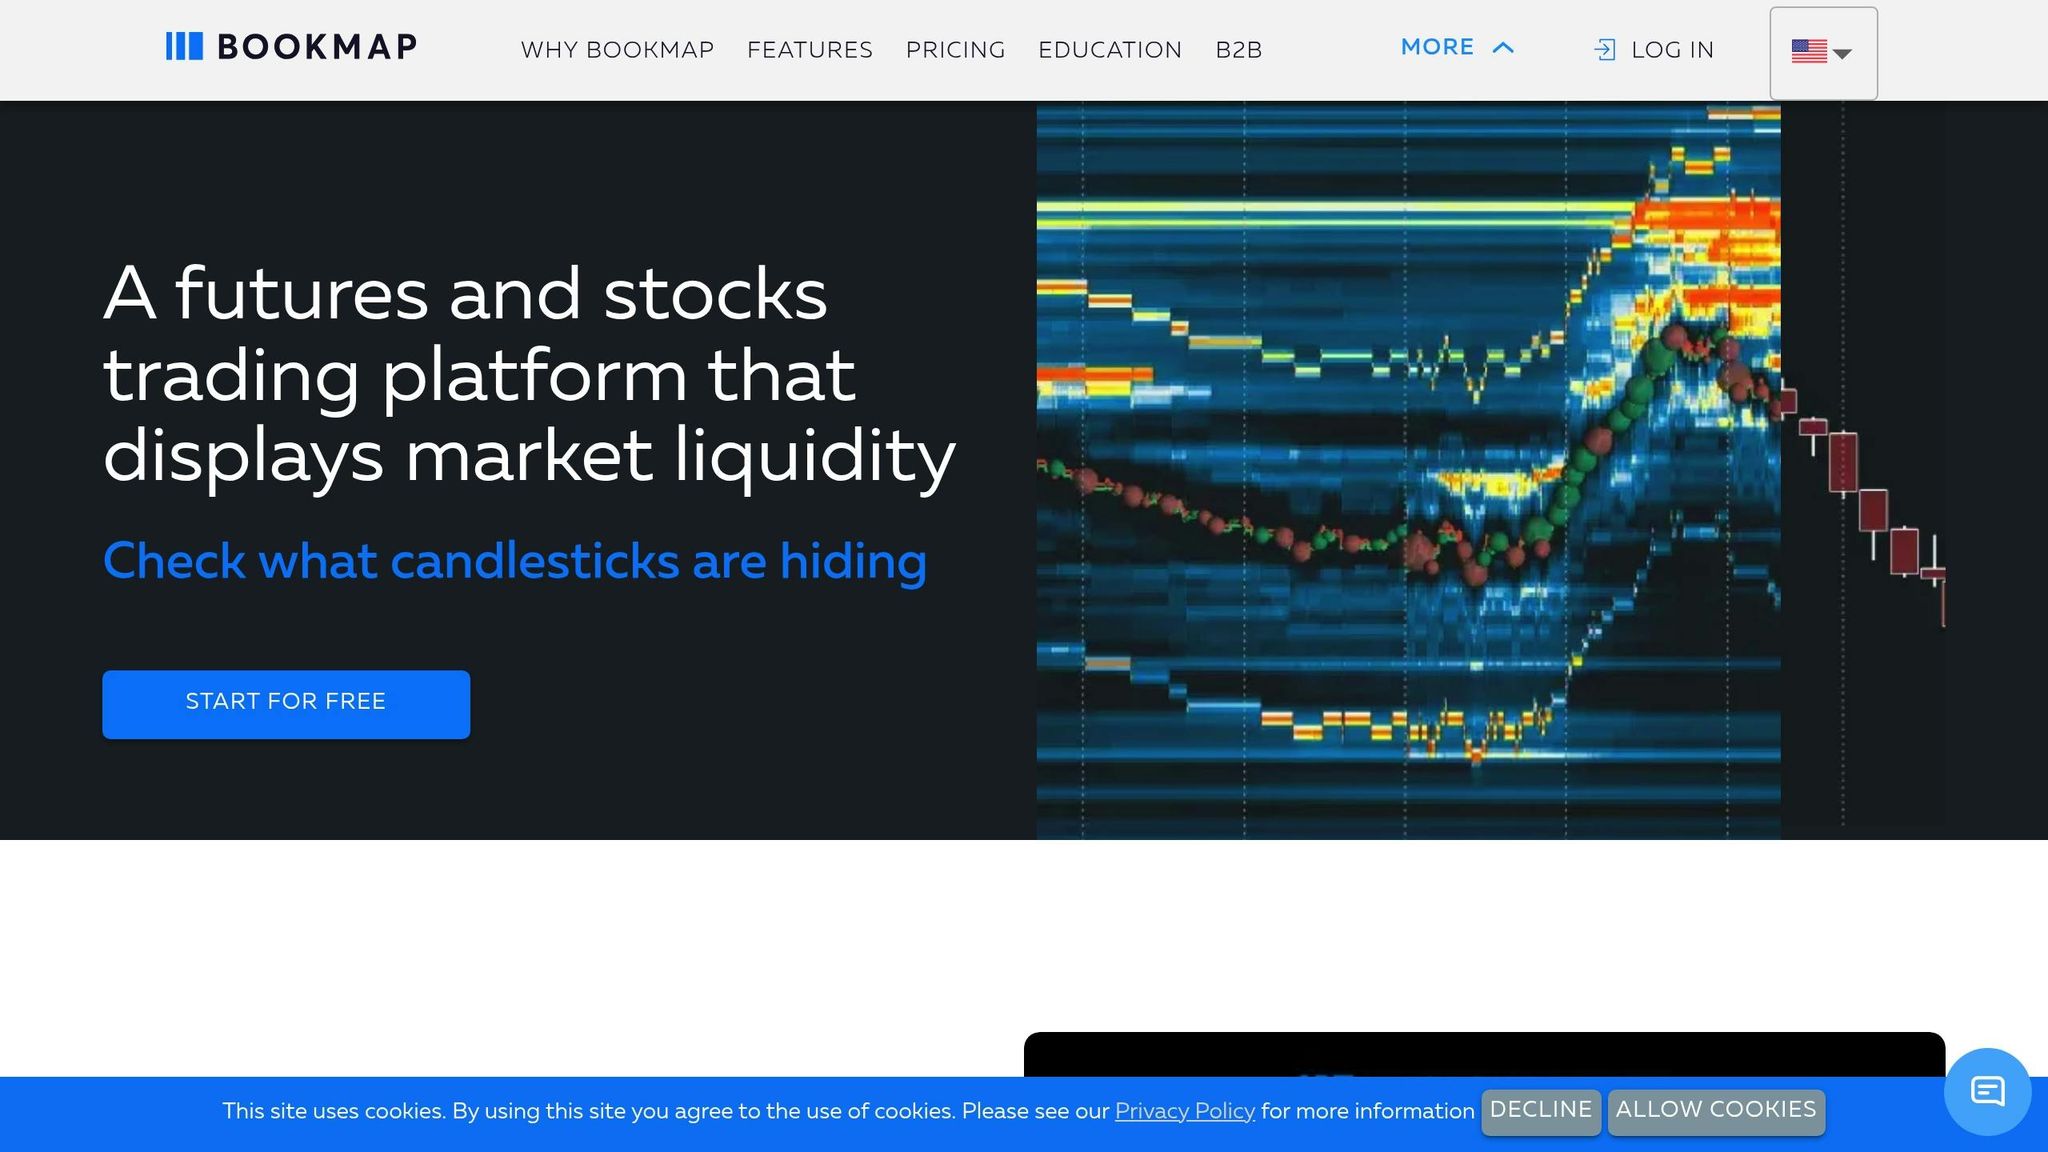
BookMap offers a suite of tools designed to provide detailed insights into market activity and liquidity in real time. Here's a breakdown of its key features:
- Liquidity Heatmap: Updates 40 times per second, highlighting support and resistance zones.
- Nanosecond Zoom: Allows for precise analysis of micro-timeframes.
- Volume Bubbles: Displays trade executions in a 3D format - green for buys and red for sells.
- Best Bid and Offer (BBO): Shows the current bid-ask spread.
- Current Order Book (COB): Visualizes real-time contract volumes and market intent.
- Large Lot Tracker (LLT): A premium add-on for tracking large orders.
Now, let’s take a closer look at what TradingView has to offer.
TradingView Core Tools
TradingView provides a robust set of tools tailored for traders who rely on charts and technical analysis. Its core features include:
- Real-Time Data and Charts: Stay updated with live market data and dynamic charting tools.
- Technical Indicators Library: Access a wide range of built-in indicators for analysis.
- Customizable Alerts: Set alerts based on specific conditions to stay informed.
- Social Trading Features: Share strategies and follow other traders for collaborative insights.
These tools are ideal for traders focused on patterns and indicators across various timeframes.
BOOKMAP VS TRADINGVIEW | WHICH TRADING ...
Platform Differences
Now that we've covered the core tools of each platform, let's dive into how their approaches to market analysis differ. While both aim to serve traders, their design priorities set them apart.
BookMap focuses heavily on order flow and market depth analysis, updating market data roughly every 30 milliseconds. This makes it ideal for traders who need ultra-detailed insights into liquidity and market movements.
On the other hand, TradingView emphasizes real-time data feeds, customizable alerts, and a vast library of technical indicators. Its user-friendly interface and broad charting tools cater to a wide range of trading styles.
Feature Comparison
| Feature | BookMap | TradingView |
|---|---|---|
| Data Refresh | ~30 ms | Real-time |
| Market Visualization | Heatmap | Price charts |
| Time Frames | Nanosecond zoom | Standard intervals |
| Order Flow Indicators | Imbalance/delta | – |
| Technical Indicators | Core flow tools | Extensive library |
| Community | – | Social network |
This comparison highlights BookMap's focus on detailed liquidity data, while TradingView excels in its extensive charting and community features.
sbb-itb-2e26d5a
Target Users
Find the platform that fits your trading style best.
BookMap User Profile
BookMap is tailored for traders who need detailed insights into order flow. It’s a solid choice for:
- High-frequency and intraday traders who rely on sub-second market updates.
- Professionals focused on analyzing order book data and heatmaps.
- Analysts seeking to pinpoint large liquidity zones or detect algorithmic patterns.
TradingView User Profile
TradingView is designed for traders who prioritize charting tools and community engagement. It works well for:
- Technical analysts using advanced drawing tools and indicators.
- Investors leveraging a library of over 10 million custom scripts.
- Community-focused traders who share and follow trading ideas.
| User Type | BookMap | TradingView |
|---|---|---|
| Ideal for | Active traders and scalpers focused on order flow | Traders and investors seeking advanced charting |
| Focus | Order book, heatmap, and order flow analysis | Chart-based technical analysis |
| Data delivery | Sub-second market updates and heatmap visuals | Real-time charting across multiple timeframes |
| Community | Limited | Extensive - 10M+ custom scripts and ideas |
Next, take a closer look at the strengths and weaknesses of each platform.
Strengths and Limitations
BookMap is tailored for high-frequency and order-flow traders, offering detailed market visualization through its heatmap technology. This tool allows scalpers and active traders to examine market microstructure with sub-millisecond precision. Features like session recording and replay, paired with its proprietary analytics, provide insights that go beyond what standard charting tools can deliver.
BookMap at a Glance
| Aspect | Details |
|---|---|
| Price Structure | Digital FREE; PLUS $16/mo; Global $39/mo; PLUS $79/mo |
| Market Coverage | Approximately 30 data feeds and brokers |
| Limitations | Additional fees for stocks/futures data |
| API Access | Full API for creating custom indicators and automation |
| User Rating | TrustScore 4.5/5 (494 reviews) |
Common Usage Examples
These examples showcase how each platform caters to different trading needs.
Professional day traders rely on BookMap's heatmap and Volume Bubbles to identify aggressive buying (blue) and selling (red) in the futures markets. In the crypto world, traders use its DOM view to pinpoint hidden liquidity and detect spoofing during periods of high volatility. These tools emphasize BookMap's ability to provide clear insights into order flow.
TradingView Community Setups
Here are some recent setups shared by TradingView's community (April 2025):
- Tesla (TSLA): A bullish outlook paired with risk management strategies (THECHAARTIST).
- Palantir (PLTR): Weekly trend reversal spotted at $90.86, with a target of $101.35 (TazmanianTrader).
- Bitcoin (BTCUSD): Double bottom formation near $74,000, aiming for a target of $105,000 (DanieIM).
These examples highlight TradingView's strength in providing collaborative insights and chart-driven signals, while BookMap's microsecond updates and replay mode help fine-tune strategy analysis.
Now, consider how these practical use cases align with your trading goals.
Making Your Choice
Choose a platform that aligns with your trading style and priorities, based on the information below.
| Trading Focus | Recommended Platform | Key Feature |
|---|---|---|
| Day Trading/Scalping | BookMap | Sub-second heatmaps and volume bubbles |
| Technical Analysis | TradingView | Extensive charting tools and indicators |
BookMap offers tools like sub-second heatmaps and volume bubbles, ideal for quick decision-making in fast-moving markets. On the other hand, TradingView stands out with its real-time charts and a large library of indicators, catering to traders focused on technical analysis.
For a more robust setup, consider using both platforms together. Pair BookMap's order-flow visuals with TradingView's comprehensive charting features. BookMap also supports automated strategies through its API, while TradingView's free tier provides essential charting tools. You can start with TradingView's free plan and later upgrade to BookMap's premium features for more specialized insights.