Free stock screeners are popular tools for investors, offering basic filtering options like market cap or P/E ratios at no cost. But they come with notable drawbacks that can impact your investment decisions. Here's a quick breakdown of the most common issues:
- Outdated or Inaccurate Data: Delayed updates and incomplete metrics can mislead investors.
- Limited Filters: Advanced or sector-specific filters (e.g., bank-specific metrics) are often missing.
- Poor Usability: Cluttered layouts and confusing navigation slow down research.
- Lack of Technical Tools: Advanced indicators like RSI or MACD are rarely available.
Key Takeaway:
Free screeners are great for basic research but need to be supplemented with other tools or strategies to avoid errors. Always validate data, combine multiple platforms, and refine your approach to make smarter investment choices.
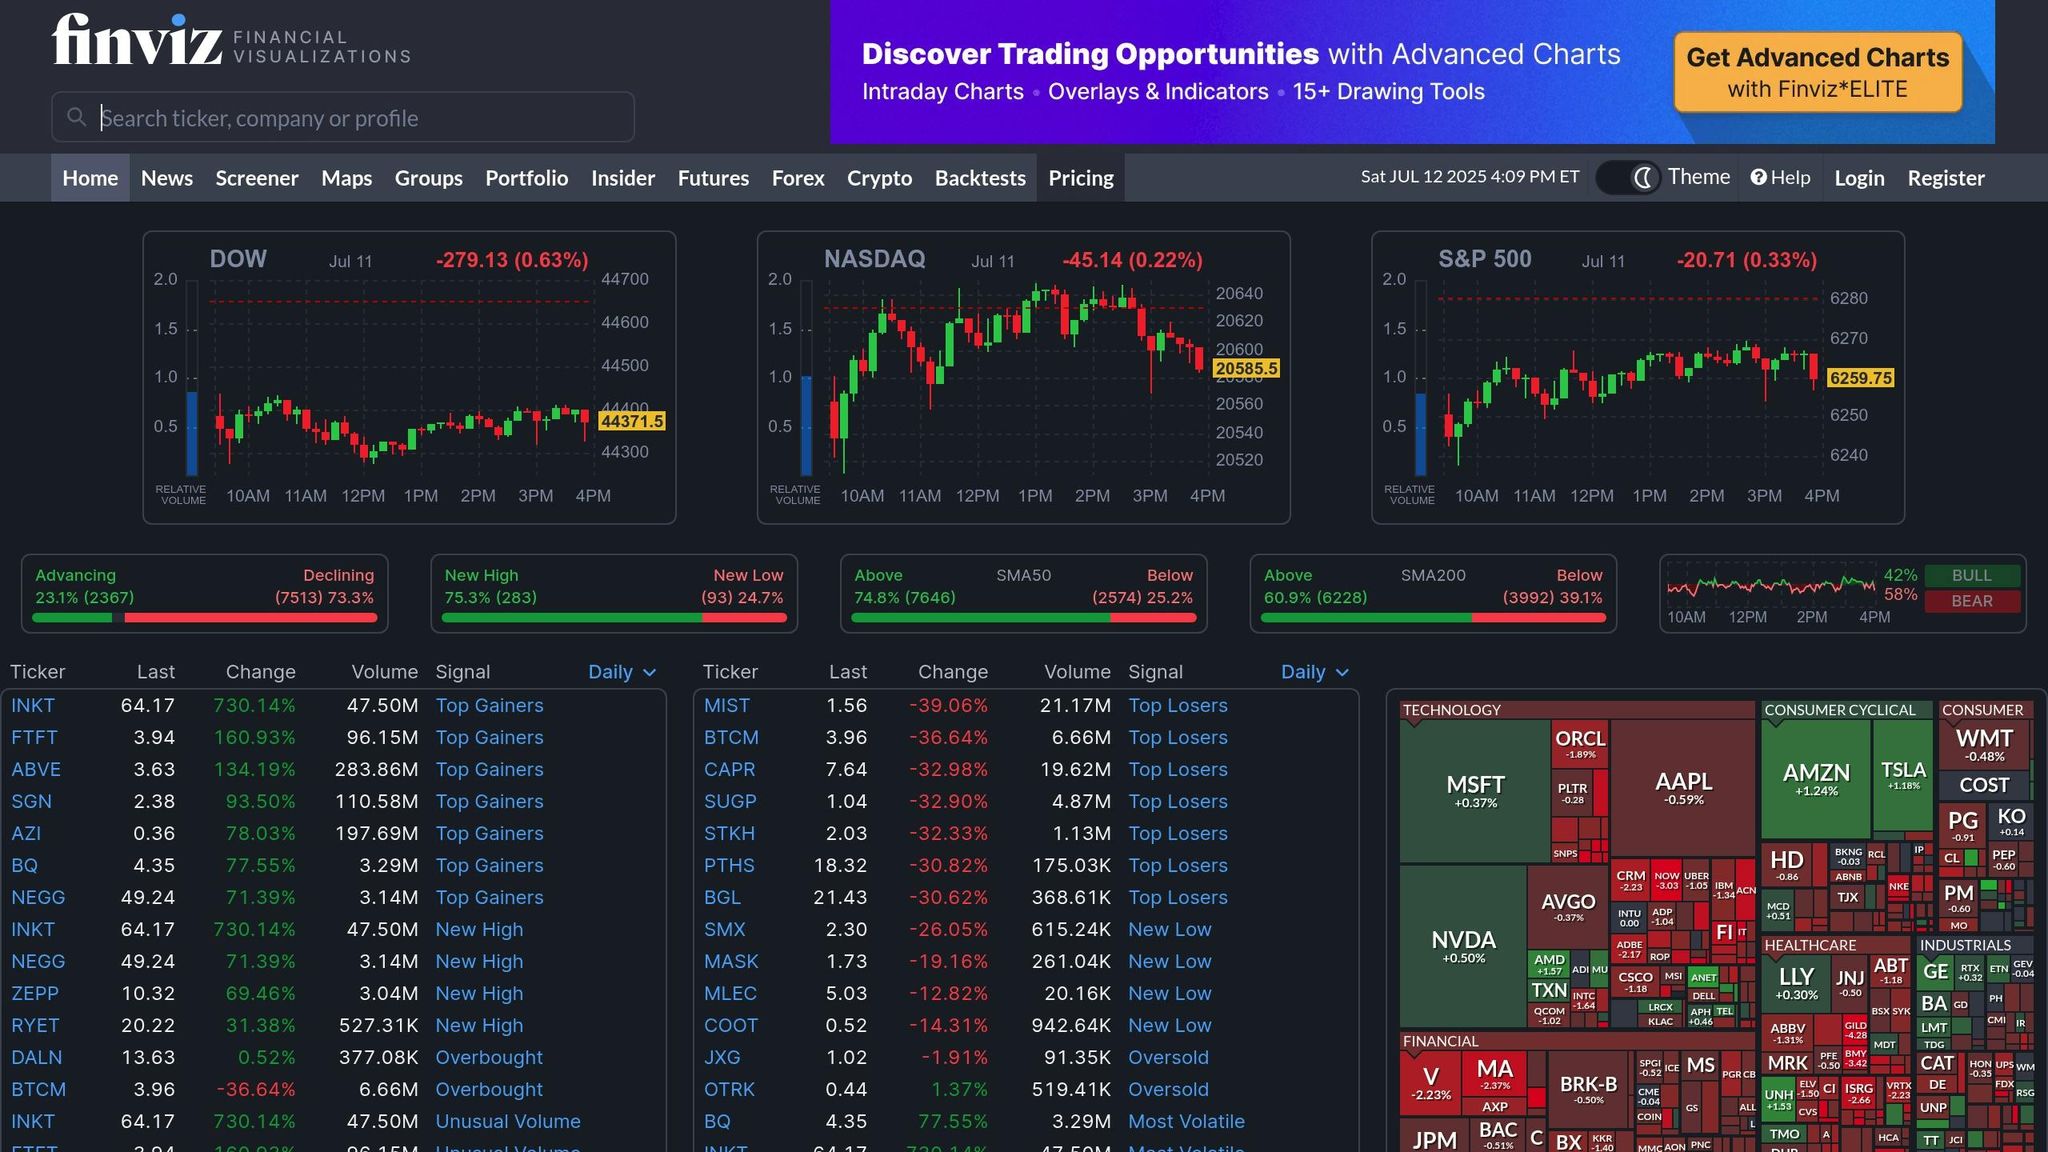
FINVIZ Stock Screener Review 📢 5 Problems You Need To Know
Limited Data Depth and Accuracy
Free stock screeners can be a helpful starting point, but they often come with a major drawback: incomplete or outdated data that can mislead investors. While these tools are convenient, their limitations may lead to flawed investment decisions.
Problems with Incomplete Data
Most free stock screeners focus heavily on quantitative metrics like P/E ratios, market cap, and revenue growth, but they often overlook qualitative factors such as leadership changes or key client losses. This narrow focus can miss critical shifts in industries or changes in a company's competitive standing.
Additionally, these tools typically provide only surface-level financial data. They rarely include more detailed insights, such as performance by business segment or forward-looking financial guidance, which are crucial for a deeper understanding of a company's potential.
Risks of Delayed Data Updates
Another common issue is the inconsistent update schedules of free stock screeners, which can result in outdated data. For example, earnings figures or debt levels might be several days, weeks, or even months old. This lag can distort your view of a company's financial health and lead to poor investment decisions.
When data is not updated regularly or accurately, it can create a false impression of stability or growth, leaving investors vulnerable to unexpected risks.
How to Improve Data Reliability
To work around these limitations, it's essential to validate and cross-check the data from your stock screener. Start by understanding how frequently your chosen screener updates its information. Then, supplement its metrics with qualitative insights from company reports, industry analyses, and news updates.
Using multiple screening tools and comparing the results can also help identify discrepancies and give you a more well-rounded view of potential investments. By combining quantitative and qualitative data from reliable sources, you can make better-informed decisions and reduce the risk of relying on incomplete or outdated information.
Limited Customization and Filter Options
Free stock screeners often come with basic filtering capabilities, which can hold back investors looking for more advanced search options. While these tools typically include standard criteria like market cap, P/E ratio, and dividend yield, they fall short of offering the detailed filters that seasoned investors rely on for executing precise strategies. This lack of depth can lead to incomplete analyses and potentially skewed investment decisions.
Common Filter Limitations
Most free screeners are designed for simplicity, making them accessible but not particularly versatile. They usually lack advanced filters tailored to specific industries. For instance, while they may suffice for quick fundamental scans, more intricate features are often locked behind a paywall.
The absence of sector-specific metrics is a major drawback. For example, when evaluating bank stocks, investors might need filters for net interest margins or loan-to-deposit ratios. Similarly, retail investors could benefit from metrics like inventory turnover ratios, while those focused on tech companies might look for research and development spending as a key factor. Without these specialized options, the tools fail to meet the needs of investors targeting specific sectors.
Impact on Advanced Investors
For experienced investors, limited filtering options can be a significant roadblock. These constraints make it difficult to tailor screenings to complex strategies like value investing, growth investing, or dividend-focused approaches. Without the ability to apply detailed filters, investors may struggle to identify stocks that align with their specific criteria.
Take value investing as an example. As of May 2023, the average P/E ratio for banks stood at approximately 8.5, while travel service companies had an average P/E ratio of 30.9. A value investor aiming to find stocks trading below their sector's average P/E ratio would face challenges with most free screeners, as they typically don’t offer sector-relative filtering options.
Technical analysts face similar issues. While some free tools include basic technical filters, they rarely go deep enough to support strategies based on chart patterns, moving averages, or momentum indicators. This lack of customization can hinder the ability to perform sophisticated technical analyses.
Ways to Expand Screening Options
There are ways to work around these limitations. For starters, using multiple free screeners can help diversify the range of filters available. By combining the strengths of different tools, investors can create a more comprehensive search process. Begin with simple filters like market cap, P/E ratio, and dividend yield, then refine the results step by step. Saving your screening criteria for future use can also streamline the process.
If certain metrics aren’t directly available, creative combinations of existing filters can sometimes approximate the missing data. For example, if a screener lacks a debt-to-equity ratio filter, you could use a mix of total debt and market cap filters to achieve a similar result.
Another helpful approach is to assign weights to various criteria based on their importance to your strategy. This scoring system allows you to rank potential investments objectively, even when working with limited filters.
Finally, regularly refine and backtest your screening methods. As markets evolve and your expertise grows, your strategies should adapt as well. Backtesting helps you evaluate the historical performance of your screens and tweak them for better results.
Free screeners should be seen as a starting point rather than a comprehensive solution. Supplementing their results with thorough research and insights from reliable sources can help bridge the gaps. While addressing customization challenges is crucial, it’s worth noting that usability issues can further complicate the investment process.
sbb-itb-2e26d5a
User Interface and Usability Problems
A poorly designed stock screener can turn what should be a straightforward process into a frustrating experience. Many free stock screeners fall short with cluttered layouts, confusing navigation, and interface issues that can slow down research or lead to mistakes in analysis.
Confusing or Hard-to-Use Layouts
One of the biggest complaints about free stock screeners is their overly crowded interfaces. These tools often cram too much information into a single screen, making it hard to find what you need. On top of that, navigating these platforms can feel like a chore - simple tasks might require multiple clicks, and filtering options are often disorganized. This lack of user-friendliness forces investors to waste time searching for the right tools, which can lead to settling for less precise screening criteria. The result? Potentially overlooking stocks that could align with your investment strategy. Fixing these usability issues can make the screening process much smoother and more effective.
How to Handle Usability Problems
Tackling these challenges starts with focusing on navigation and layout. The first step is choosing a platform that aligns with your needs. Some stock screeners prioritize simplicity, offering clean layouts and a solid range of filters. While these tools might not have every advanced feature, their straightforward design can save you time and hassle.
Once you've selected a screener, take the time to master it. Rather than bouncing between multiple platforms, stick to one or two that suit your investment approach and learn their ins and outs. As Doug Roman, Managing Director of Equities at PNC Capital Advisors, puts it:
"The more subjective part of your investment process should be the last step."
Start with clear investment goals to stay focused. Use broad criteria like region, market capitalization, sector, or dividend yield to set up your initial search. From there, refine your filters step by step. This systematic method can help you make sense of even the most cluttered interfaces.
When evaluating different platforms, look for a balance between functionality and ease of use. Some screeners strike this balance well, offering powerful tools without overwhelming users. Don’t overlook lesser-known platforms either - they might provide unique opportunities that bigger names miss.
It’s also essential to keep expectations realistic. As Robert Johnson, Professor of Finance at Heider College of Business at Creighton University, advises:
"One should certainly not invest in all companies that pass an initial screening process. The screening process should identify those firms that warrant further attention."
By remembering that a stock screener is just the first step in your research, you can keep interface frustrations in perspective. It’s a tool to narrow down options - not the final word on where to invest.
While usability issues can slow you down, they don’t have to derail your investment strategy entirely. With the right approach and tools, you can navigate even the most challenging platforms effectively.
Missing Technical and Advanced Analysis Tools
Free stock screeners are great for getting a snapshot of basic company details like revenue, earnings, and market cap. However, they often fall short when it comes to offering advanced technical tools. For investors who rely on technical analysis, this limitation can make it harder to dive deep into market trends and make well-timed decisions.
Challenges for Technical Analysts
If you're a technical analyst, you've probably noticed that most free stock screeners lack the advanced indicators and charting tools needed for precise market analysis. While these platforms can help identify stocks based on fundamental metrics, they usually don’t offer the depth of tools required to refine entry and exit points.
Some of the key indicators missing from free screeners include the Relative Strength Index (RSI), Moving Average Convergence Divergence (MACD), Average Directional Index (ADX), and On-Balance Volume (OBV). For technical analysts, combining multiple indicators is often essential, yet free tools rarely support layering these features on a single chart. This shortfall affects everyone from day traders to long-term investors, potentially leading to missed opportunities.
Expanding Your Toolkit for Technical Analysis
The lack of advanced tools in free screeners doesn’t mean you have to give up on technical analysis. There are several ways to enhance your capabilities without spending a fortune:
- Leverage broker platforms. Many online brokers offer advanced trading platforms for free if you open an account. These platforms often include robust technical tools. For example, some brokers integrate services like Trading Central, which can automatically detect chart patterns and highlight key technical levels.
- Stick to a few key indicators. Instead of trying to use every technical tool available, focus on a combination of two or three that work well together. For instance, pairing a trend indicator like ADX with a momentum oscillator like RSI and a volume tool like OBV can help you make better-informed decisions.
- Explore specialized technical screeners. Platforms like Scanz are built specifically for technical analysis. They allow users to filter stocks based on price-driven indicators and create custom scans tailored to specific strategies. While these tools often come with a subscription fee, they can be a valuable resource for serious traders.
- Tap into educational content. Many free platforms include tutorials and articles on technical analysis. Understanding how indicators work and how to apply them can make even basic tools more effective.
If you’re looking for a more detailed comparison of charting tools and platforms, the Best Investing Tools Directory (https://bestinvestingtools.com) is a helpful resource. It can guide you in finding options that suit both your budget and your trading style.
Ultimately, mastering technical analysis isn’t just about having access to advanced tools - it’s about understanding market behavior. Start small by experimenting with a couple of indicators on a practice account. As you gain experience, you can refine your approach and gradually expand your toolkit.
Conclusion
Free stock screeners can be a helpful starting point for investors, but they often fall short in areas like data quality, customization, usability, and technical features. These limitations can create obstacles, but they don’t have to derail your investment strategy if you approach them thoughtfully and supplement them with the right tools.
To navigate these challenges, focus on aligning your tools with your specific investment goals. Look for platforms that offer the data accuracy and features you need, whether your strategy involves fundamental analysis, technical analysis, or a mix of both. Prioritize tools with intuitive interfaces, strong customer support, and trial options so you can test them before committing.
For investors looking for deeper insights into available tools, the Best Investing Tools Directory (https://bestinvestingtools.com) is an excellent resource. This guide highlights tools with advanced features like backtesting, comprehensive fundamental analysis, and real-time data - capabilities that free screeners often lack. It also covers a wide range of resources, from investment research and newsletters to charting and technical analysis platforms, helping you find options that align with your unique strategy.
Ultimately, successful investing isn’t about having the most advanced tools - it’s about using the tools you have effectively. Start with what’s accessible, identify where your current setup falls short, and fill those gaps with solutions tailored to your needs. Over time, this approach will help you build a research system that grows and adapts alongside your investing experience.
FAQs
How can I trust the accuracy of data from free stock screeners for investment decisions?
Free stock screeners are a great starting point, but they’re not perfect. The data they provide might sometimes be outdated or incomplete. To make sure you’re working with accurate information, it’s a good idea to cross-check important details with primary sources like company earnings reports, SEC filings, or official press releases. These sources can confirm critical facts that a screener might overlook.
If accuracy is a top priority, look for screeners that offer real-time data and are known for their reliability. It’s also smart to compare data from multiple tools regularly. This approach can minimize errors and give you a clearer picture, helping you make better investment choices.
How can I work around the limited filtering options in free stock screeners?
When free stock screeners fall short on filtering options, you can work around these limitations by using multiple screeners together. This combination lets you tap into a broader range of criteria, giving you a fuller picture of potential investments.
Another option is to explore platforms with advanced customization features or tools powered by AI. These can provide more precise filtering capabilities, helping you zero in on investment opportunities that match your goals, even if free tools have their constraints.
What are some affordable ways to access advanced technical analysis tools not offered by free stock screeners?
If you're on the hunt for budget-friendly ways to access powerful technical analysis tools, platforms like StockCharts and TradingView are worth considering. They offer a wide range of charting and analysis features through subscription plans that won't break the bank.
Additionally, many brokerage firms, such as Fidelity and E*TRADE, provide advanced tools as part of their trading platforms. The best part? These tools are often included at no extra charge for account holders.
These options give you access to professional-grade features without the steep costs of premium software, making them a smart choice for investors who want more than basic, free stock screeners without overspending.