Earnings surprise tools help investors analyze how a company’s reported profits differ from analyst predictions. These tools use historical data, machine learning, and financial metrics to estimate the likelihood and impact of earnings surprises on stock prices. Positive surprises often lead to stock price gains, while negative ones can signal underlying issues. Key features of these tools include:
- Data Sources: Analyst forecasts, company guidance, SEC filings, and market trends.
- Prediction Models: Machine learning algorithms (e.g., linear regression, neural networks) and ensemble methods like Random Forest and Gradient Boosted Models.
- Key Metrics: Earnings ESP (Expected Surprise Prediction), with stocks showing ESP values above 1% delivering higher returns historically.
Investors can use these tools to refine strategies, whether focusing on short-term trading or long-term investments. However, tools should be tested regularly, and predictions should be cross-checked with broader market research to minimize risks like data bias or market anomalies.
Core Methods Used in Earnings Surprise Tools
Data Sources for Earnings Surprise Tools
Earnings surprise tools rely on a variety of data sources to make their predictions. Analyst forecasts are a key component, with platforms like S&P Capital IQ Estimates offering financial estimates for thousands of companies contributed by a wide network of analysts. Visible Alpha Estimates further enriches these forecasts by incorporating models from over 200 brokerage firms.
Company guidance also plays an important role, as it provides insights into expected profits, helping to fine-tune prediction models. Additionally, SEC filings supply detailed financial and strategic information. Analysts further enhance these models by integrating qualitative insights gathered from management discussions and industry trends. Together, these diverse data sources serve as the backbone for the predictive models discussed below.
Prediction Models and Algorithms
The data collected feeds into advanced predictive models designed to forecast earnings surprises. These tools rely on a mix of historical data, statistical techniques, and machine learning algorithms. Common approaches include classification, clustering, and time series models.
Machine learning algorithms, ranging from linear regression and decision trees to more advanced neural networks, power these models. Linear algorithms are faster and work well with simpler relationships, while nonlinear methods excel at uncovering more intricate patterns, though they require more computational power. For example, nonlinear models have demonstrated the ability to predict earnings surprises exceeding 15% with 71% accuracy using pricing and earnings data.
Ensemble methods further improve predictions by combining multiple models. Random Forest, for instance, uses bagging to create subsets of training data, allowing it to handle a large number of input variables while minimizing overfitting. On the other hand, Gradient Boosted Models (GBM) use boosting techniques, sequentially adjusting weights to correct errors in earlier iterations. While GBM often achieves better generalization, it tends to be slower than other methods.
Filtering Noise for Better Predictions
To provide accurate forecasts, earnings surprise tools must filter out market noise and focus on meaningful signals. Deep learning algorithms are particularly effective at processing unstructured data, while traditional machine learning methods handle structured financial data. This dual approach ensures the tools can analyze both quantitative metrics and qualitative insights, offering a comprehensive view of the factors driving earnings surprises.
Pattern recognition is another critical element. By studying historical relationships between financial metrics and earnings surprises, tools identify indicator combinations that consistently lead to accurate predictions. For instance, stepwise logit regression has been used to predict future earnings changes and create profitable hedge portfolios, showcasing the value of properly filtered financial data.
Managing outliers and focusing on relevant timeframes also enhances prediction accuracy. Research into the tech sector's arbitrage profits highlights this point. A study published in the Journal of Finance and Data Science found a linear relationship between predicted earnings surprises and short-term stock returns, with extreme outliers driving much of the significance. Another analysis of the U.S. tech sector from 1994 to 2000 revealed that portfolios with the most positive earnings surprises consistently outperformed those with the most negative surprises. Trading strategies based on these differences generated notable arbitrage profits two to three months after quarter-end, particularly for companies with limited analyst coverage.
How to Use Earnings Surprise Tools
Finding and Choosing the Right Tools
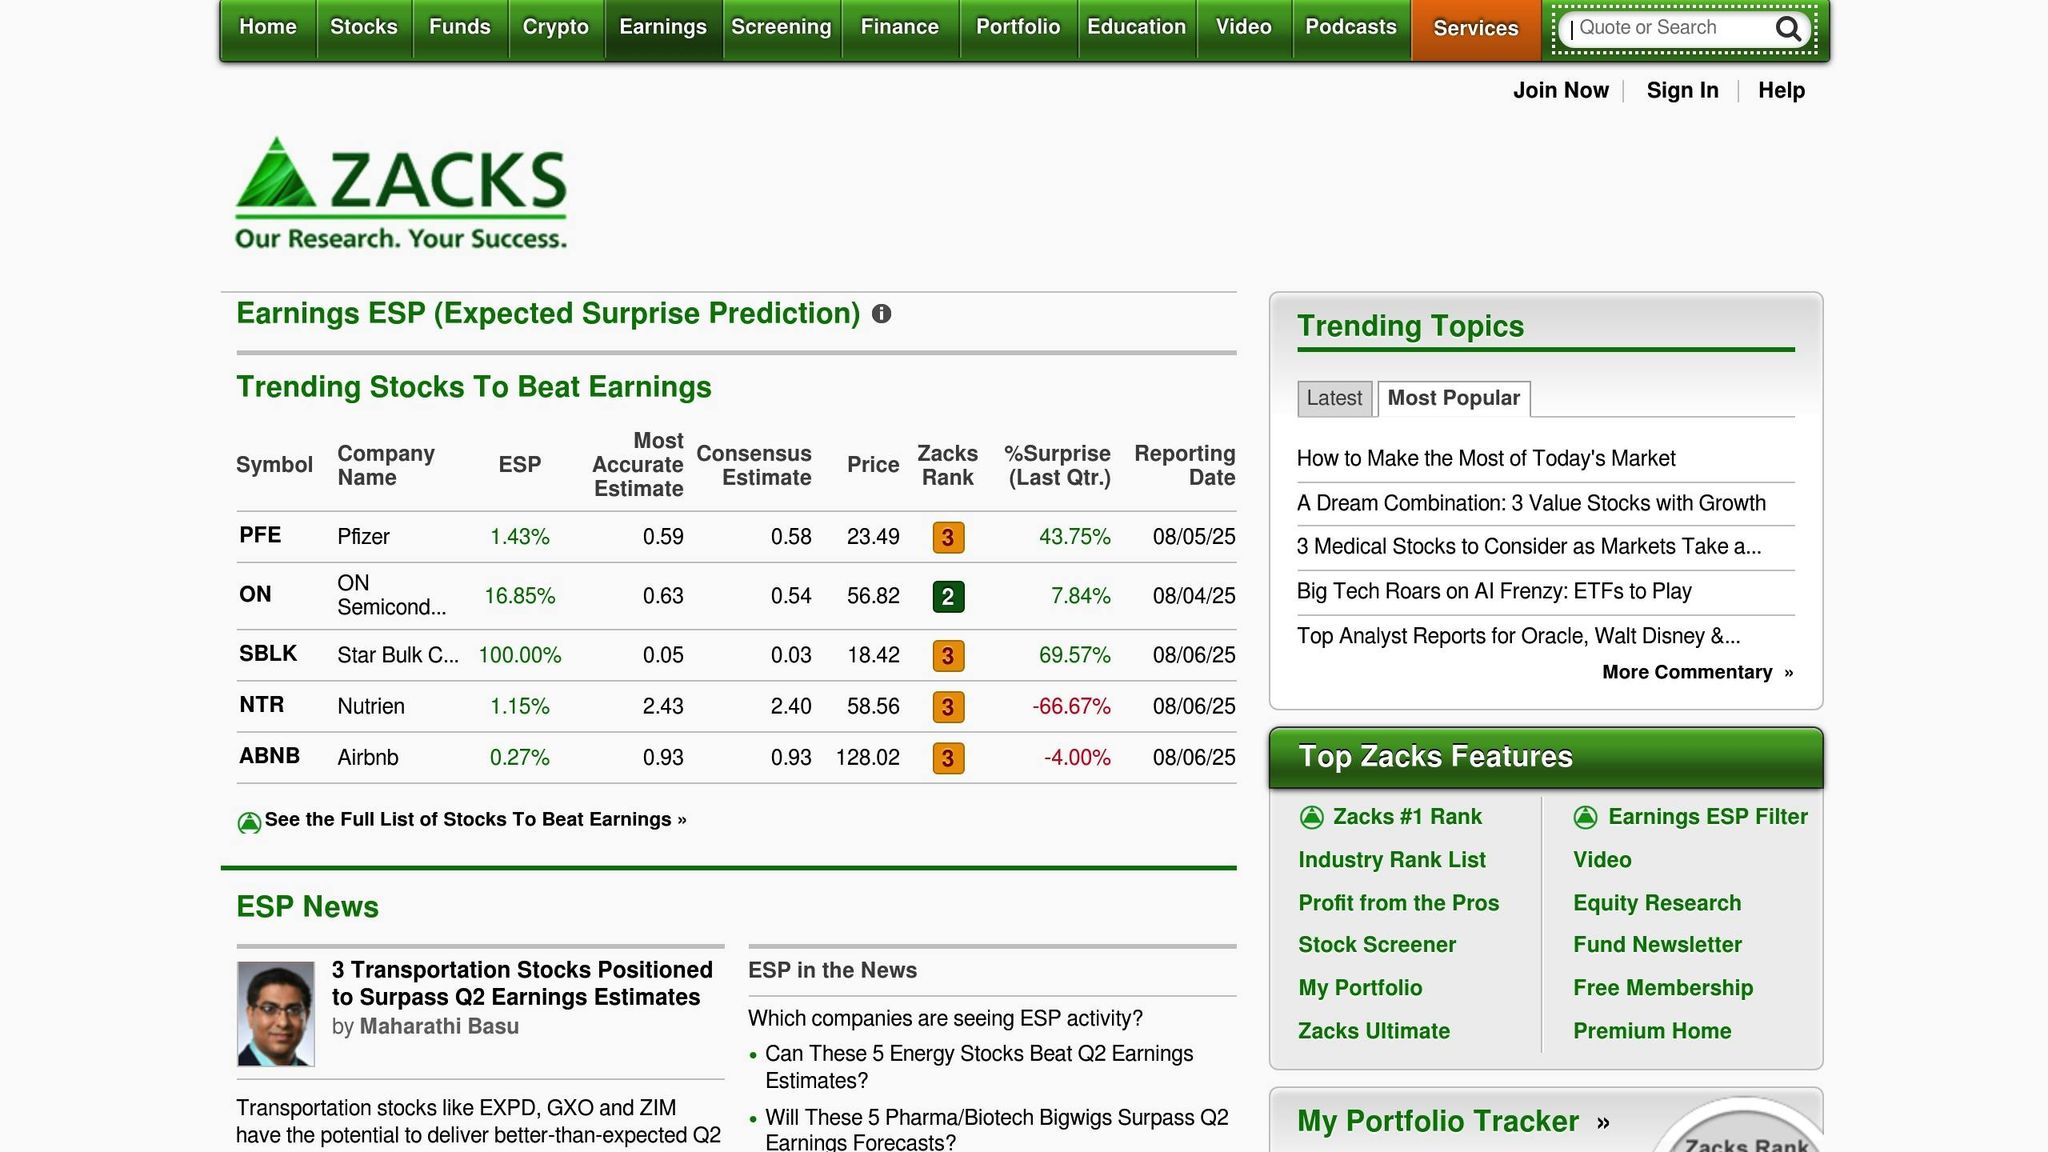
Selecting the right earnings surprise tool depends on your investment goals and risk tolerance. For example, Zacks Earnings ESP is a popular choice, known for predicting positive surprises with a 70% accuracy rate. This tool becomes even more effective when paired with stocks ranked #1, #2, or #3 by Zacks, as these stocks have a 70% likelihood of positive surprises.
If you're looking for broader data access, Financial Modeling Prep (FMP) offers an Earnings Surprises API, tracking announcements and surprises across thousands of companies. Similarly, Visible Alpha's Surprise Analysis Feature provides insights into both the size and direction of potential earnings surprises.
For a more comprehensive resource, visit the Best Investing Tools Directory (https://bestinvestingtools.com). This platform lists vetted earnings surprise tools and other investment research options, complete with user reviews and filters to help you find tools tailored to your needs - whether you're an individual investor or managing institutional portfolios.
Once you've chosen a tool, it's essential to understand how to interpret its outputs.
Reading Tool Outputs
To make informed decisions, focus on the key metrics provided by your chosen tool. One critical measure is the Earnings ESP (Expected Surprise Prediction). Stocks with an ESP of at least 1% have historically delivered average annual returns of 29.6%, while those with ESP levels above 3% have achieved 37.2% annual returns.
When analyzing positive surprises, pay attention to the EPS (earnings per share) differences. This helps you separate sustainable growth from one-off events. These details are crucial for making tactical investment decisions.
Boris Lerner, Global Head of Quantitative Equity Research at Morgan Stanley, highlights this approach:
"We've found that one of the best ways for investors to find alpha in earnings surprises is to go long high-quality stocks that have recently beaten consensus earnings and revenue estimates, and short low-quality stocks that have missed expectations."
Keep an eye on ESP readings as market conditions and analyst revisions evolve.
Adding Tools to Your Investment Strategy
Incorporating earnings surprise tools into your strategy can refine your timing and portfolio adjustments. For instance, momentum traders often act immediately after announcements. This approach can yield quick results but demands swift decision-making and a higher risk tolerance.
On the other hand, long-term value investors might benefit from focusing on companies that consistently deliver positive surprises. These patterns often point to strong management and stable business models. Additionally, companies with a history of negative surprises but improving fundamentals may present attractive turnaround opportunities.
Earnings surprises aren't limited to specific sectors, so diversifying your approach can be advantageous. Tools like the Zacks Earnings ESP Filter can help identify stocks with high surprise potential across various industries. Combining surprise analysis with other metrics, such as earnings quality, can further enhance your strategy. For example, a simulation from January 1994 to June 2020 showed that strategies combining composite surprises with earnings quality yielded 7.7% annual returns - outperforming those focused solely on composite surprises (2.5%) or earnings quality (5.0%).
For the best results, complement surprise analysis with thorough fundamental research.
Predicting Market Reactions: Uses and Risks
Common Market Reaction Patterns
Understanding how market reactions to earnings surprises have evolved is key to using predictive tools effectively. Over the years, the way stock prices respond to earnings announcements has shifted. For example, average announcement returns dropped from +0.30% in the 1990s to -0.30% in the 2010s. This change highlights how markets have become better at factoring in earnings expectations before announcements are made.
The surprises themselves have also changed. In the 1990s, the mean analyst forecast error was -$0.02, but by the 2010s, it had shifted to +$0.02. This could mean companies are improving at managing expectations, or analysts have refined their forecasting methods.
Interestingly, companies are now focusing on delivering large beats rather than just meeting or slightly exceeding forecasts. While the frequency of meeting or beating consensus remains steady, small positive surprises no longer excite the market as they once did. In fact, the market's reaction to surprises close to zero has become negligible over time.
For investors, this means that tools capable of identifying significant beats are far more valuable than those predicting marginal surprises. The ability to distinguish between modest and major surprises can make a big difference in this landscape.
Key Factors That Influence Market Responses
Market reactions to earnings surprises are shaped by more than just the surprise itself. A variety of factors come into play, and understanding these can help you get more out of your predictive tools.
Information density has surged around earnings announcements. For instance, the percentage of announcements accompanied by management forecasts jumped from 3% to 36% between 1999 and 2016. Similarly, concurrent analyst forecasts rose from 33% to 70% during the same period. The number of financial statement line items disclosed also grew significantly, from 23% to 57%. This flood of information amplifies market reactions. Metrics like USTAT (price revision measure) and AVOL (abnormal volume statistic) have seen substantial increases, reflecting this heightened activity.
Company characteristics also play a role. Factors like company size, profitability, financial leverage, and institutional shareholding influence how the market reacts. For instance, larger firms with more institutional ownership often see muted reactions to small surprises, while smaller firms may experience more volatile responses.
Sector dynamics add another layer of complexity. Industries like technology, which face higher growth expectations, may see less impact from positive surprises compared to sectors like utilities, where earnings are more predictable.
When using earnings surprise tools, these factors are crucial. For example, predicting a positive surprise for a large-cap stock with extensive analyst coverage might call for a different strategy than the same prediction for a smaller company with limited coverage. Recognizing these nuances helps set realistic expectations for tool performance.
Limits and Risks of Earnings Surprise Tools
Earnings surprise tools, while powerful, have their limitations. Misunderstanding these can lead to costly errors, so it’s important to approach them with caution.
One issue is that market anomalies can distort cumulative abnormal returns (CAR) during earnings announcements. These distortions might make a tool’s prediction appear incorrect, even if the underlying forecast was accurate.
Another challenge is bias in the data these tools rely on. For instance, short-selling restrictions can create an optimistic bias in analyst forecasts, which may lead tools to underestimate the likelihood of negative surprises. Additionally, as analyst forecasts become less reliable, the tools that depend on them may also lose accuracy.
There’s also the risk of tools identifying patterns that don’t translate into actionable insights. This can happen due to false signals or overfitting to historical data. A tool that worked well in one market cycle might falter when market conditions or investor behavior changes.
To address these risks, avoid relying solely on one tool or signal. Cross-check predictions with fundamental analysis and broader market trends. Adjusting cumulative abnormal returns using stock price jumps can offer a clearer picture of investor reactions. Tools that incorporate revised market reaction measures may also help account for anomalies and the flood of concurrent information.
Ultimately, earnings surprise tools are best used as part of a broader investment strategy. They’re not meant to be standalone buy or sell signals but rather a way to identify opportunities for deeper research. The most successful investors use these tools to complement their overall approach, ensuring a more balanced and informed decision-making process.
How to Use the Zacks Earnings ESP (Expected Surprise Prediction) Filter
sbb-itb-2e26d5a
Choosing and Testing Earnings Surprise Tools
Building on the earlier discussion about how earnings surprise tools can guide investment decisions, this section delves into selecting and testing these tools to ensure they align with your strategy.
Key Factors for Tool Selection
Choosing the right earnings surprise tool involves evaluating several crucial aspects. Data reliability is paramount - your decisions hinge on accurate information, so prioritize tools that source their data from well-regarded financial databases and use transparent methodologies. In today’s fast-moving markets, update frequency is another must-have feature. The best tools refresh their predictions multiple times daily, factoring in the latest analyst revisions, management guidance updates, and other market developments.
Integration with your existing workflow is also key. Whether you rely on portfolio management software, custom alerts, or data export capabilities, the tool should fit seamlessly into your routine. During earnings seasons, when information overload is common, tools with strong filtering capabilities can help you focus on key signals. For example, filtering out irrelevant data ensures critical insights don't get lost in the noise.
A solid track record is another indicator of a tool’s reliability. For instance, one system has successfully predicted positive earnings surprises 80% of the time since 2014. Requesting historical performance data and ensuring the tool’s accuracy across varying market conditions can provide valuable insights into its effectiveness.
Finally, consider the tool’s coverage scope. Some platforms focus on large-cap stocks with extensive analyst coverage, while others specialize in small- or mid-cap companies, where earnings surprises may be more frequent but harder to anticipate. Your portfolio composition and investment style should guide this choice. These factors collectively help identify a tool that complements your investment process.
Using Best Investing Tools Directory

Once you’ve outlined your selection criteria, a resource like the Best Investing Tools Directory can simplify the comparison process. This directory offers detailed reviews of earnings surprise tools alongside other investment research platforms, such as newsletters and technical analysis services.
When browsing the directory, pay close attention to user reviews that highlight earnings prediction capabilities. Look for feedback on data accuracy, ease of use, and customer support. The directory’s filtering options make it easy to tailor your search based on your specific requirements, whether you’re an individual investor or managing institutional portfolios.
The directory also provides insights into how tools integrate with broader investment strategies. For instance, you might discover that certain earnings surprise tools pair well with specific charting software or options analysis platforms. Additionally, the directory’s comparison features allow you to evaluate pricing structures upfront, helping you plan your budget effectively.
Regular Testing and Updates
After selecting a tool, testing its performance is essential to ensure it meets your expectations. Start by tracking its predictions against actual earnings for at least one quarter. Document not only whether the direction of the surprise was accurate but also how well the tool predicted the market’s reaction. A simple tracking spreadsheet can help you record predictions, actual earnings results, and subsequent stock price movements. This process highlights the tool’s strengths and weaknesses across different sectors and market conditions.
As markets evolve, reassess the tool’s performance regularly and adjust your benchmarks as needed. Stay informed about updates or new features from your provider. Many platforms refine their algorithms continuously, so subscribing to newsletters or attending webinars can help you stay in the loop.
It’s also wise to rotate tools periodically to compare performance and stay aware of new options. Set clear performance benchmarks for your tools, and don’t hesitate to switch if one consistently underperforms. Prioritize tools that focus on predicting earnings growth relative to expectations rather than just absolute figures.
"Earnings growth is important, but earnings surprise is eminent." - AXA IM
Conclusion: Getting the Most from Earnings Surprise Tools
Earnings surprise tools can be a valuable asset for refining market predictions, but their effectiveness depends on how well they align with your investment approach. The real advantage comes from using these tools thoughtfully, focusing on reliable signals instead of chasing every forecast.
A well-rounded strategy incorporates various factors - not just earnings surprises. For instance, combining earnings surprise predictions with quality rankings can significantly improve success rates. In fact, positive surprises paired with high-quality rankings have shown success rates of up to 70%. As Boris Lerner from Morgan Stanley puts it:
"The key for investors is having a trading strategy that separates true economic break‐outs from technical noise. At the end of the day, it's all about the quality of earnings."
It’s vital to dig deeper than just headline figures. Look at underlying revenue growth to assess whether performance improvements are sustainable or simply a result of temporary cost-cutting.
Your strategy should also adapt to shifting market conditions. Since ESP values can change daily as earnings reports approach, regular monitoring is essential. Stocks with ESP levels of at least 1% often present better opportunities for higher returns. And remember, earnings surprises aren’t limited to specific sectors or market sizes - they happen across the board. As you refine your approach, don’t overlook the importance of precise risk management.
Options strategies, like long straddles, can be especially useful during earnings season, allowing you to capitalize on volatility while managing risk. Diversifying across sectors and conducting thorough research beyond just surprise predictions are crucial steps for building a sound investment plan.
To maximize the potential of these tools, consistency is key. Regularly backtest your strategies, track performance, and stay informed about updates to methodologies. By integrating these practices into your broader investment strategy, you can turn earnings season into an ongoing opportunity to achieve better-than-average results.
FAQs
How do earnings surprise tools use machine learning to enhance their predictions?
How Earnings Surprise Tools Use Machine Learning
Earnings surprise tools use machine learning to analyze massive amounts of financial data and uncover patterns that might otherwise go unnoticed. By applying advanced methods like neural networks, decision trees, and ensemble models, these tools examine historical performance, market trends, and external factors to predict earnings surprises with greater precision.
What sets these tools apart is their ability to detect nonlinear relationships and identify temporal patterns in the data. This means they can spot subtle shifts and trends that traditional methods might miss. For investors, this translates into sharper insights about how markets might react to upcoming earnings reports, empowering them to make smarter decisions based on these predictions.
What should investors look for when selecting an earnings surprise tool?
When picking an earnings surprise tool, it's crucial to focus on how well it predicts earnings surprises and its reliability. The best tools combine quantitative data, like revenue growth and profit margins, with qualitative factors, such as market sentiment or media coverage, to give a well-rounded analysis.
You should also check if the tool evaluates post-earnings market reactions, like stock price changes after earnings announcements. The right tool will offer data-driven insights presented in a way that's easy to act on, helping you make smarter portfolio choices. Opt for tools with a solid track record to strengthen your investment approach.
How can investors use earnings surprise predictions to improve their trading strategies?
Earnings surprise predictions offer investors a valuable edge in sharpening their trading strategies. By spotting companies likely to deliver better-than-expected earnings, investors can position themselves to capitalize on potential stock price gains. On the flip side, identifying negative surprises can help avoid losses - or even create opportunities through short-selling.
Zeroing in on earnings surprises driven by strong revenue growth or steady performance can lead to smarter decisions and help manage risks. Another key tactic is keeping an eye on stock price movements after earnings reports. These shifts, often tied to market overreactions or underreactions - known as the post-earnings drift - can present opportunities for savvy investors. By blending these insights with a disciplined trading approach, investors can better align their strategies with market dynamics and improve their results.