Want to manage your investments smarter and faster? Investment dashboards simplify tracking your portfolio, offering real-time updates, risk analysis, and performance insights - all in one place. Whether you're a retail investor or a seasoned trader, these tools help you make better decisions with less effort.
Key Benefits of Investment Dashboards:
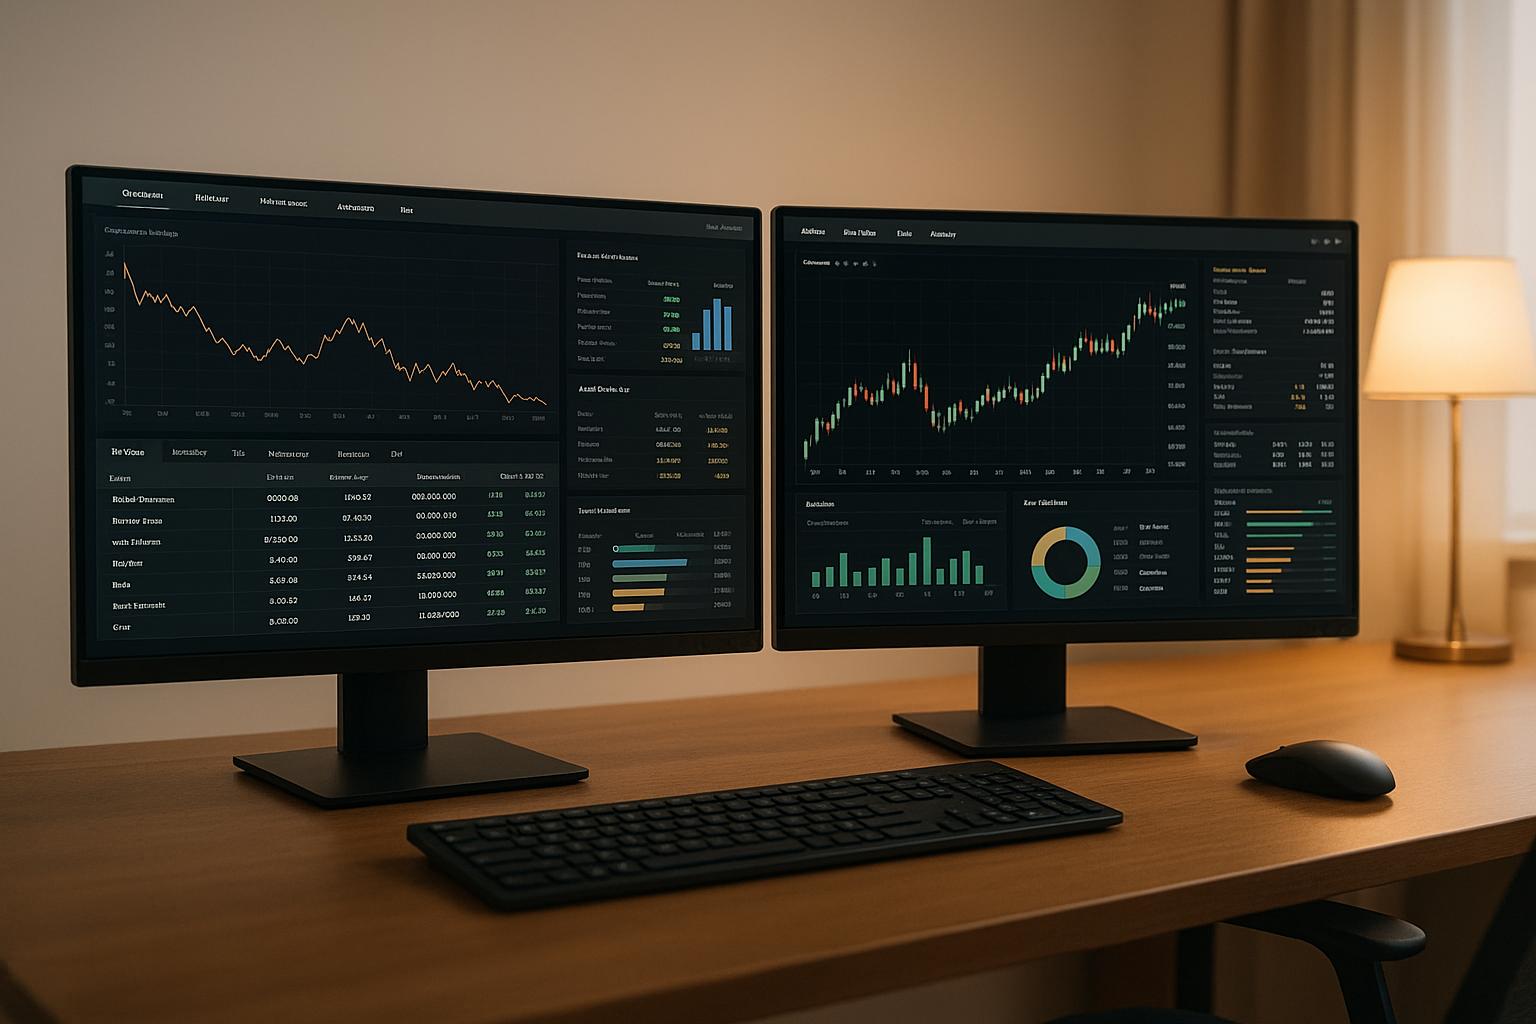
- Real-Time Monitoring: See live updates on your portfolio's value and performance.
- Data Consolidation: View all investments across accounts in one dashboard.
- Risk Assessment: Spot vulnerabilities with tools like volatility and Sharpe ratio tracking.
- Performance Analysis: Track returns, income, and asset allocation trends.
How to Start:
- Choose the Right Platform: Look for features like integration with brokers, customization, and strong security (e.g., Stock Rover, TradingView, or Koyfin).
- Track Key Metrics: Focus on returns, risk, allocation, and income for a complete view.
- Sync Your Data: Connect brokerage accounts and enable automatic updates for accuracy.
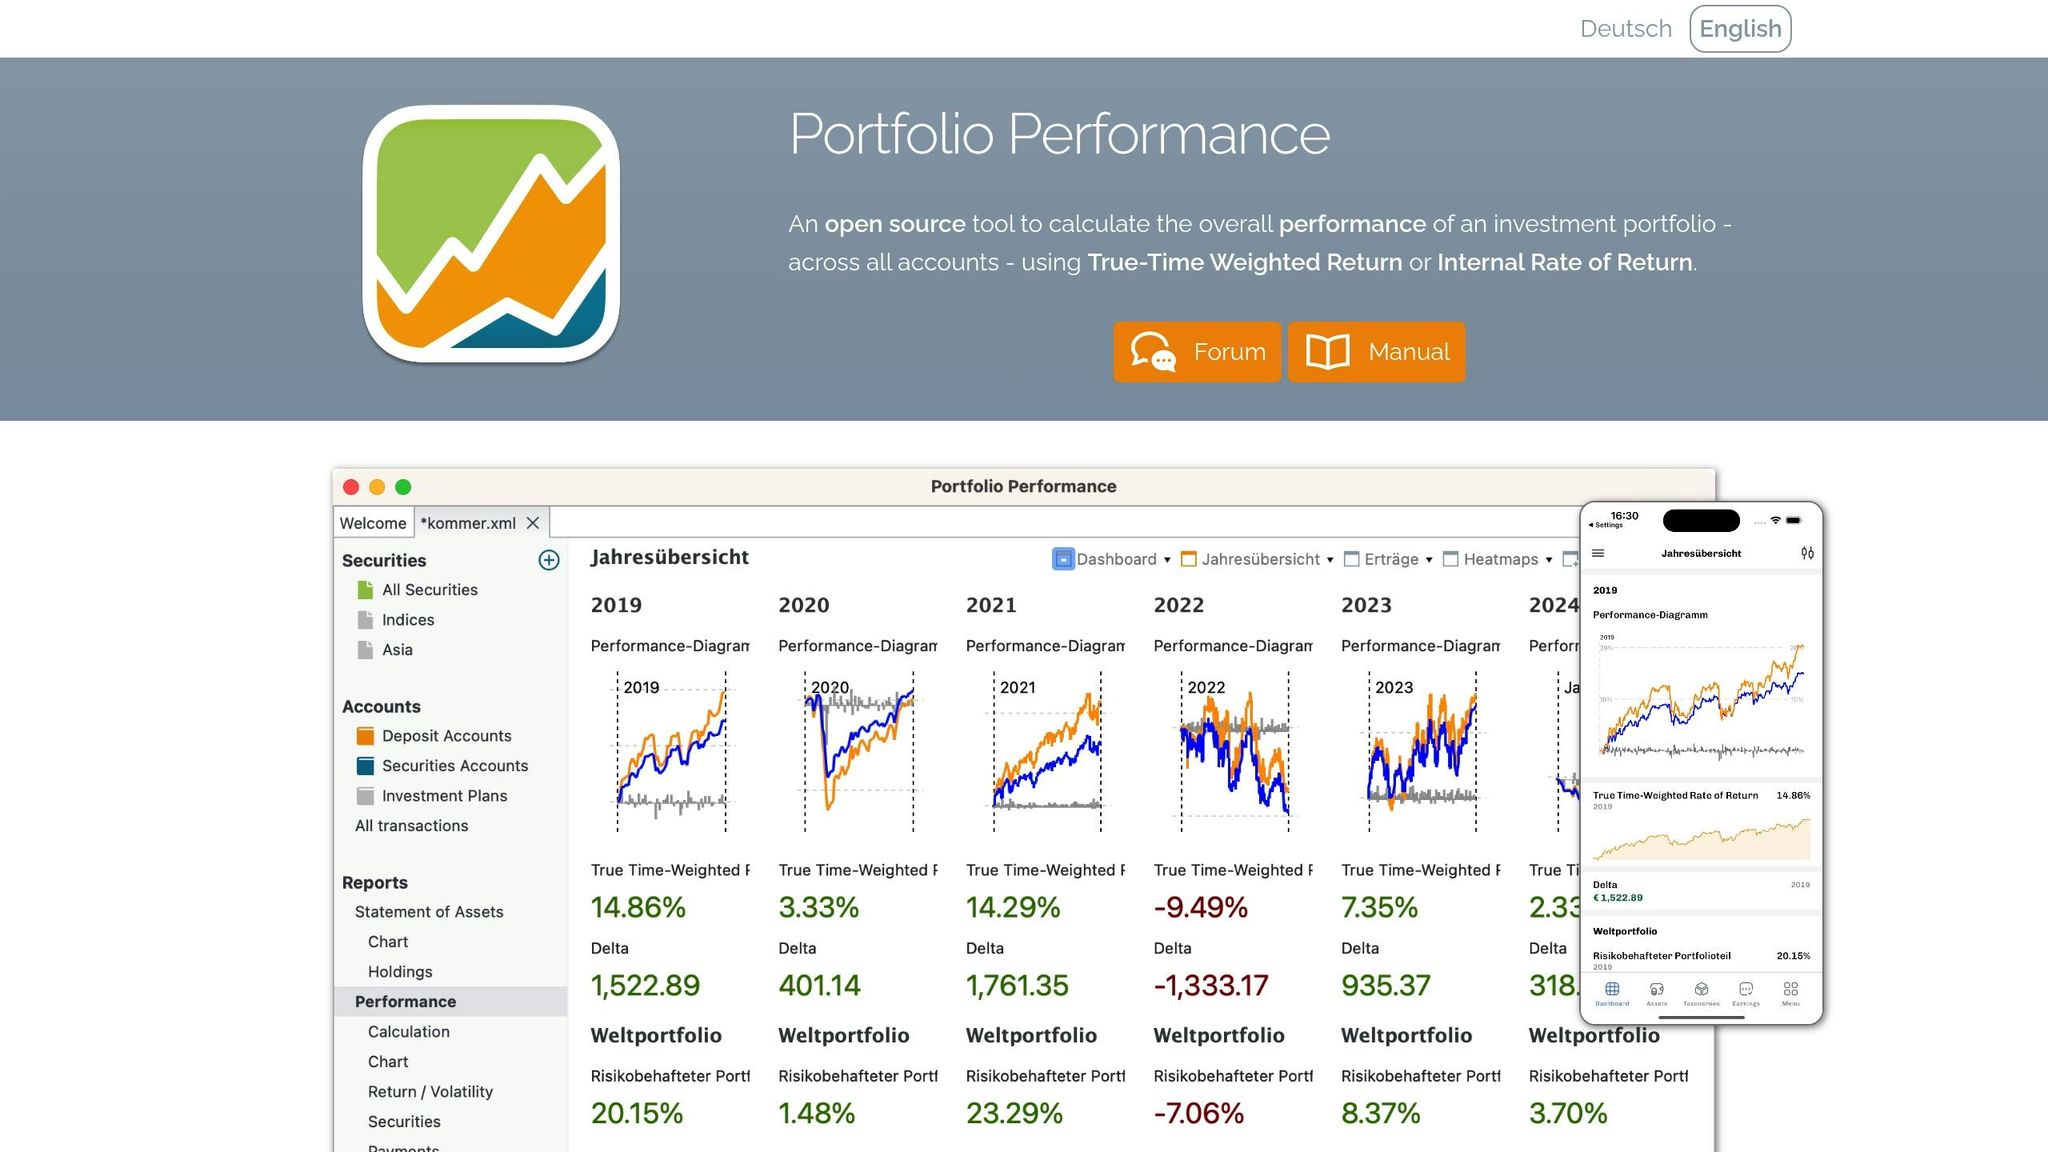
Pro Tip: Platforms like Portfolio Performance and Kubera offer advanced tools like performance attribution and scenario testing to help you optimize your strategy.
Dashboards save time, reduce manual errors, and help you stay on top of market changes. Ready to simplify your investment tracking? Let’s dive in.
Setting Up Your Investment Dashboard
Selecting Dashboard Software
Choosing the right dashboard software is all about aligning it with your investment strategy and technical comfort level. Here are some key features to consider:
| Feature Category | Essential Capabilities | Why It Matters |
|---|---|---|
| Integration | Supports multiple broker connections and APIs | Keeps your data updated automatically |
| Customization | Offers flexible metrics and custom layouts | Tailors the dashboard to your strategy |
| Security | Includes encryption and secure authentication | Safeguards your sensitive financial information |
| Accessibility | Provides mobile apps and web interfaces | Lets you monitor your portfolio anytime, anywhere |
For a detailed breakdown of the best platforms available, check out the Best Investing Tools Directory at https://bestinvestingtools.com. A popular choice is Portfolio Performance, known for its customizable features and ease of use.
Once you've picked your software, the next step is identifying the metrics that will help you keep tabs on your portfolio.
Core Performance Metrics
To effectively monitor your portfolio, your dashboard should track these key metrics:
| Metric Type | Key Measurements | Update Frequency |
|---|---|---|
| Returns | Total return, YTD, 1/3/5-year performance | Daily |
| Risk | Volatility, Sharpe ratio, maximum drawdown | Weekly |
| Allocation | Breakdown by asset class, sector, and geography | Monthly |
| Income | Dividends, interest, and distributions | As received |
For instance, Portfolio Performance provides real-time updates on these metrics, making it easier to stay informed. These measurements are essential for regular monitoring and decision-making, and they work seamlessly with your dashboard’s data integration features.
Connecting Data Sources
Integrating your data is crucial for maintaining an up-to-date view of your portfolio. Here’s how to do it:
- Connect Brokerage Accounts: Link your accounts and import historical data using CSV files or direct feeds. This establishes a baseline for tracking your portfolio's performance.
- Verify Key Metrics: Double-check the accuracy of your metrics across different time periods to ensure consistency.
Set your dashboard to sync data automatically, but keep the option for manual updates when needed. Additionally, enable alerts for significant changes in your portfolio metrics. This way, you’ll stay informed about important shifts without having to monitor constantly. It’s a practical approach that mirrors professional portfolio management while remaining accessible for individual investors.
Portfolio Performance Tutorial (Free Investment Portfolio Tracker)
Daily Dashboard Management
Keeping a close eye on your investment dashboard every day helps you respond to real-time data and manage risks effectively.
Live Performance Updates
Real-time updates are essential for staying on top of your portfolio's performance. Set up your dashboard with custom widgets that prominently display key metrics like profit/loss and market positions.
| Update Type | Refresh Rate | Key Indicators |
|---|---|---|
| Portfolio Value | Every 5 minutes | Total assets, day's gain/loss, % change |
| Asset Allocation | Daily | Sector weights, geographic exposure |
| Risk Metrics | Hourly | Volatility indicators, correlation factors |
Make sure your dashboard is equipped with tools that provide a clear picture of risk management.
Risk Measurement Tools
Tracking risk metrics gives you a better understanding of your portfolio's volatility and its relationship to the market. Focus on these key indicators:
- Standard Deviation: Measures the daily volatility of returns.
- Beta Values: Tracks how your portfolio moves in relation to market benchmarks.
- Maximum Drawdown: Identifies the largest potential loss from peak to trough.
- Sharpe Ratio: Assesses returns in relation to the risks taken.
Regularly reviewing these metrics can help you make informed adjustments to your portfolio.
Chart and Graph Settings
Customizing your charts and graphs is another way to improve your dashboard's usability. Here are some tips for better visualization:
- Set default timeframes that align with your investment goals.
- Use color coding to highlight important thresholds or alerts.
- Add comparison overlays to benchmark your portfolio against relevant indices.
- Enable technical indicators that match your strategy.
These settings allow you to tailor chart types, timeframes, and indicators to suit your specific investment needs.
When presenting data, ensure it adheres to US conventions: currency in USD (e.g., $125,000.50), dates formatted as MM/DD/YYYY, and proper numeric separators for clarity.
For more resources and reviews of reliable dashboard tools, check out the Best Investing Tools Directory.
sbb-itb-2e26d5a
Professional Dashboard Features
Professional dashboards come equipped with advanced tools that make portfolio analysis more precise, helping investors make informed, data-backed decisions.
Performance Factor Analysis
These dashboards often incorporate the Brinson-Fachler Attribution Model, which breaks down portfolio performance into three key components:
| Attribution Component | What It Measures | Why It Matters |
|---|---|---|
| Allocation Effect | Evaluates asset class decisions | Confirms the effectiveness of your strategic choices |
| Selection Effect | Assesses security picks within asset classes | Measures how well individual securities were chosen |
| Interaction Effect | Examines the combined impact of allocation and selection | Highlights the synergy between allocation and selection decisions |
Investment professionals note that performance attribution tools can reveal the factors driving around 70-80% of a portfolio's outperformance or underperformance. This level of insight makes these dashboards invaluable for monitoring and improving investment strategies, especially when managing multiple portfolios.
Multiple Portfolio Oversight
After breaking down performance, professional dashboards provide tools to manage and compare multiple portfolios effectively. These features are particularly useful for investors juggling various account types, such as retirement funds, taxable accounts, or education savings. Key functionalities include:
- Consolidated Views: Combine data from all portfolios into a single, comprehensive performance summary.
- Account Segmentation: Group accounts by type for better organization.
- Standardized Metrics: Use consistent benchmarks for meaningful comparisons.
- Custom Reports: Generate tailored reports for different stakeholders or purposes.
For example, Kubera's dashboard offers visualization tools that demonstrate how individual assets contribute to overall net worth performance across various portfolios.
Market Scenario Testing
Once your portfolio is analyzed and organized, testing its resilience under different market conditions becomes essential. Professional dashboards often include tools for:
- Historical Event Simulation: Assess how your portfolio would have performed during past market crises, such as the 2008 financial crash or the 2020 pandemic.
- Custom Scenario Builder: Design stress tests by tweaking variables like interest rates, market corrections, sector-specific shocks, or inflation rates.
- Monte Carlo Simulations: Run thousands of simulations to explore a wide range of potential outcomes, helping you gauge the likelihood of different performance scenarios.
These features are seamlessly integrated into many platforms, giving investors the ability to proactively manage risks. Regular scenario testing ensures portfolios are better prepared for unexpected market shifts.
Conclusion
Key Dashboard Benefits
Investment dashboards bring everything together, offering a centralized way to track portfolios with real-time updates and clear analytics. They simplify complex data, save time by reducing manual tasks, and support better decision-making. Here’s a quick breakdown of their benefits:
| Benefit | Impact | Outcome |
|---|---|---|
| Real-Time Monitoring | Instant visibility into portfolio activity | Faster market responses |
| Data Consolidation | All investments in one view | Fewer data entry mistakes |
| Visual Analytics | Easy-to-read performance insights | Improved pattern recognition |
| Risk Management | Early identification of risks | Quick issue resolution |
Platforms like Kubera’s investment dashboard illustrate how these tools can simplify portfolio management while keeping track of assets across various types. These benefits make it easier to take timely action and stay ahead.
Getting Started
Setting up an effective investment dashboard doesn’t have to be complicated. Here’s how to get started:
- Define Core Metrics: Identify the metrics that align with your investment goals and provide actionable insights.
- Choose the Right Platform: Explore tools that offer features like automated syncing, reporting, risk analysis, and portfolio attribution. A good starting point is the Best Investing Tools Directory.
- Establish a Consistent Review Process: Schedule regular check-ins to ensure your dashboard stays in sync with your strategies and market changes.
FAQs
What key features should you consider when selecting an investment dashboard?
When selecting an investment dashboard, focus on tools that simplify tracking and decision-making. Prioritize platforms with real-time data updates, customizable metrics, and easy-to-read visualizations such as charts and graphs. These features can help you stay on top of your investments and analyze your portfolio more effectively.
It's also important to choose a dashboard that offers integration with your brokerage accounts, ensuring your data syncs effortlessly. Look for additional features like performance tracking over time, risk analysis, and comparison tools to gain deeper insights into your investments. For a closer look at available options, consider exploring directories that review platforms offering research, charting, and analysis tools specifically designed for investors.
How can I keep my investment dashboard accurate and up-to-date?
To keep your investment dashboard accurate and current, start by linking it to trusted data sources like your brokerage accounts or reputable financial platforms. Many dashboards offer automatic syncing, which can save you from tedious manual updates and help reduce errors.
Make it a habit to review and adjust your dashboard settings regularly, especially when your portfolio changes - like adding new investments or rebalancing assets. It’s also a good idea to schedule periodic reviews, whether monthly or quarterly, to ensure all key metrics - such as stock prices, asset allocation, and performance trends - are updating correctly. Platforms like Best Investing Tools Directory can guide you toward dependable software to make this process smoother.
What features do professional investment dashboards offer to improve strategy and manage risks effectively?
Professional investment dashboards are packed with advanced features designed to help investors fine-tune their strategies and manage risks more effectively. These tools often include real-time portfolio tracking, customizable performance metrics, and risk analysis features that can pinpoint potential weak spots in your investments. Many dashboards also sync with external platforms, pulling in live market data and offering insights by analyzing historical trends.
To make data more digestible, some dashboards feature visual analytics like charts and heatmaps, which help you spot patterns and opportunities at a glance. Others go a step further by providing advanced forecasting tools and setting up alerts to keep you informed about market shifts. If you're looking for highly rated tools to improve your investment tracking, directories like Best Investing Tools can guide you to platforms that range from technical analysis software to advanced charting solutions.