In trading, combining tools like MenthorQ levels and Unusual Whales options data can help you make more informed decisions. MenthorQ uses gamma data to identify key price levels, such as support and resistance zones, while Unusual Whales tracks unusual options activity and institutional trades. Together, they offer a way to confirm trade setups and reduce risk.
Here’s how they work:
- MenthorQ levels: Highlight areas where market makers’ hedging affects price stability or volatility.
- Unusual Whales data: Tracks large trades, block orders, and options flow to reveal institutional sentiment.
- Combined strategy: Use MenthorQ to identify critical price zones and confirm them with Unusual Whales’ real-time options activity.
This approach can improve trade timing, risk management, and confidence by aligning technical levels with market sentiment. For example, pairing MenthorQ’s gamma levels with Unusual Whales’ block trade data near these zones can signal strong opportunities.
Key takeaway: Use MenthorQ to map price zones and Unusual Whales to validate trade direction, ensuring your strategy is grounded in both technical and flow-based insights.
What Menthor Q’s swing model sees that most traders miss...
What Are MenthorQ Levels
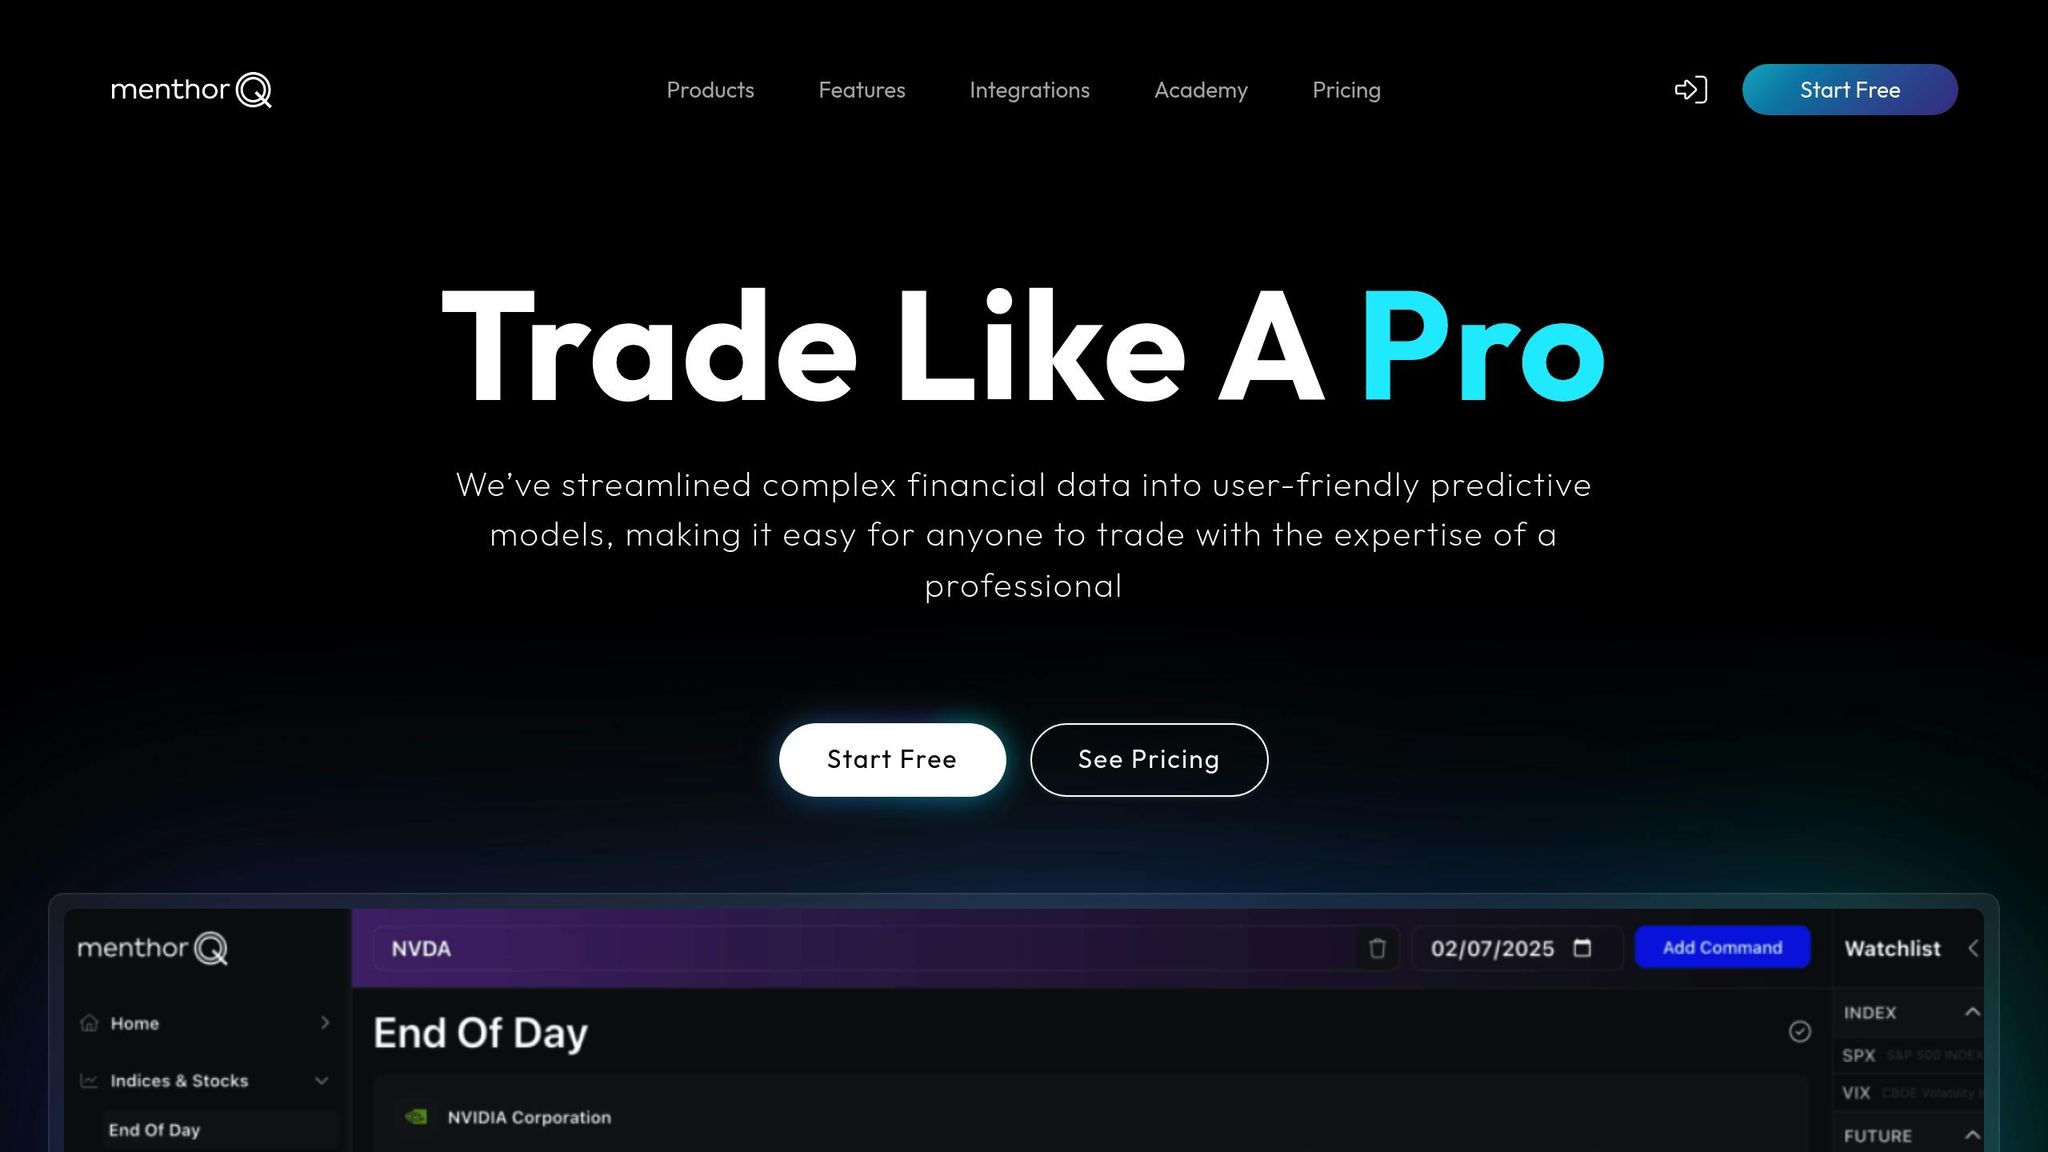
MenthorQ levels highlight key price zones influenced by significant positive or negative gamma, reflecting market positioning and open interest. These levels indicate areas where gamma exposure can stabilize prices.
Unlike traditional indicators that rely on past price data, MenthorQ levels are forward-looking. They are calculated based on current dealer positioning. By processing open interest and market positioning, MenthorQ pinpoints crucial price zones. This involves analyzing the entire options chain to locate areas with high positive or negative Net GEX (gamma exposure).
MenthorQ covers 1,300+ assets, including U.S. stocks, ETFs, indices, major forex pairs, futures, and cryptocurrencies. For major currency futures like EUR/USD (6E), GBP/USD (6B), USD/JPY (6J), and AUD/USD (6A), it identifies areas with significant gamma positioning by analyzing the options chain. Combining these levels with options flow data can be a game-changer for traders seeking confident trade alignment.
How MenthorQ Gamma Levels Work
Gamma exposure plays a critical role in how market makers adjust their hedges as prices fluctuate. With positive gamma, market makers tend to buy when prices drop and sell when prices rise, creating a stabilizing effect that makes prices "stick" around certain levels. On the other hand, negative gamma leads to the opposite behavior - selling during declines and buying during rallies, which can amplify price movements.
MenthorQ identifies several types of key levels:
- Call Resistance: Zones where heavy call positioning may limit upward price movement.
- Put Support: Areas where put positioning could offer a price floor.
- High Vol Level (HVL): Regions prone to volatility spikes.
For U.S. equities and ETFs, these gamma levels update 14+ times daily starting from market open. This frequent updating captures shifts in gamma positioning as markets move throughout the day. The levels are delivered via API, ensuring traders always have up-to-date insights.
Additionally, the system provides Blind Spots Levels, which highlight reaction zones influenced by cross-asset gamma positioning - areas that traditional support and resistance tools often overlook. This deeper understanding of gamma dynamics is especially valuable for traders aiming to enhance their strategies.
Benefits of MenthorQ Levels for U.S. Traders
MenthorQ levels bring several advantages compared to traditional indicators like moving averages or RSI. Since they’re based on actual options positioning rather than historical price data, they offer insights into potential market reactions before they occur.
One key benefit is improved timing for trade entries and exits. These levels help traders identify precise entry points, exit strategies, and manage risk effectively. They also help anticipate volatility spikes and sudden price shifts, providing an edge in fast-moving markets.
"By allowing me to trade when I would normally sit out, the data has already paid for itself several years over. I'm still wrapping my head around all the nuance; but the comradery in the premium chat is helping me get better every day." - Mark, MenthorQ Customer
MenthorQ integrates seamlessly with popular trading platforms like TradingView, NinjaTrader, MetaTrader 5, TrendSpider, Quantower, and Thinkorswim. This integration enables traders to overlay gamma levels with their existing analysis tools for a more comprehensive view.
The platform also offers a Q-Score, a composite indicator combining options activity, volatility, momentum, and 20-year seasonality data. This gives traders a broader perspective on market sentiment beyond gamma positioning.
Limitations of MenthorQ Levels
While MenthorQ levels are powerful, they come with some limitations. The VEX (Volatility Exposure) calculations assume a linear relationship between implied volatility and option prices, which doesn’t always hold in every market condition.
The system also doesn’t account for second-order effects like vanna (changes in the slope of the implied volatility surface) or volga (curvature effects). These factors can impact option prices, especially in complex portfolios.
Another challenge is data quality. Accurate VEX measurements require high-quality data and advanced modeling, which may be a hurdle for smaller traders without specialized tools.
There are also update frequency limitations. For example, TradingView restricts the GEX indicator to a maximum of five external data updates per day. Additionally, some indicators experience a 15-minute delay after market open.
For SPX, 0DTE (Zero Days to Expiration) options and GEX levels rely on open interest data from market open. However, gamma levels for these options narrow significantly throughout the day and aren’t updated intraday like other expirations.
Despite these drawbacks, MenthorQ levels remain a valuable tool when used with proper understanding. Recognizing these constraints helps traders align their expectations and make more informed decisions.
Using Unusual Whales Options Flow Data
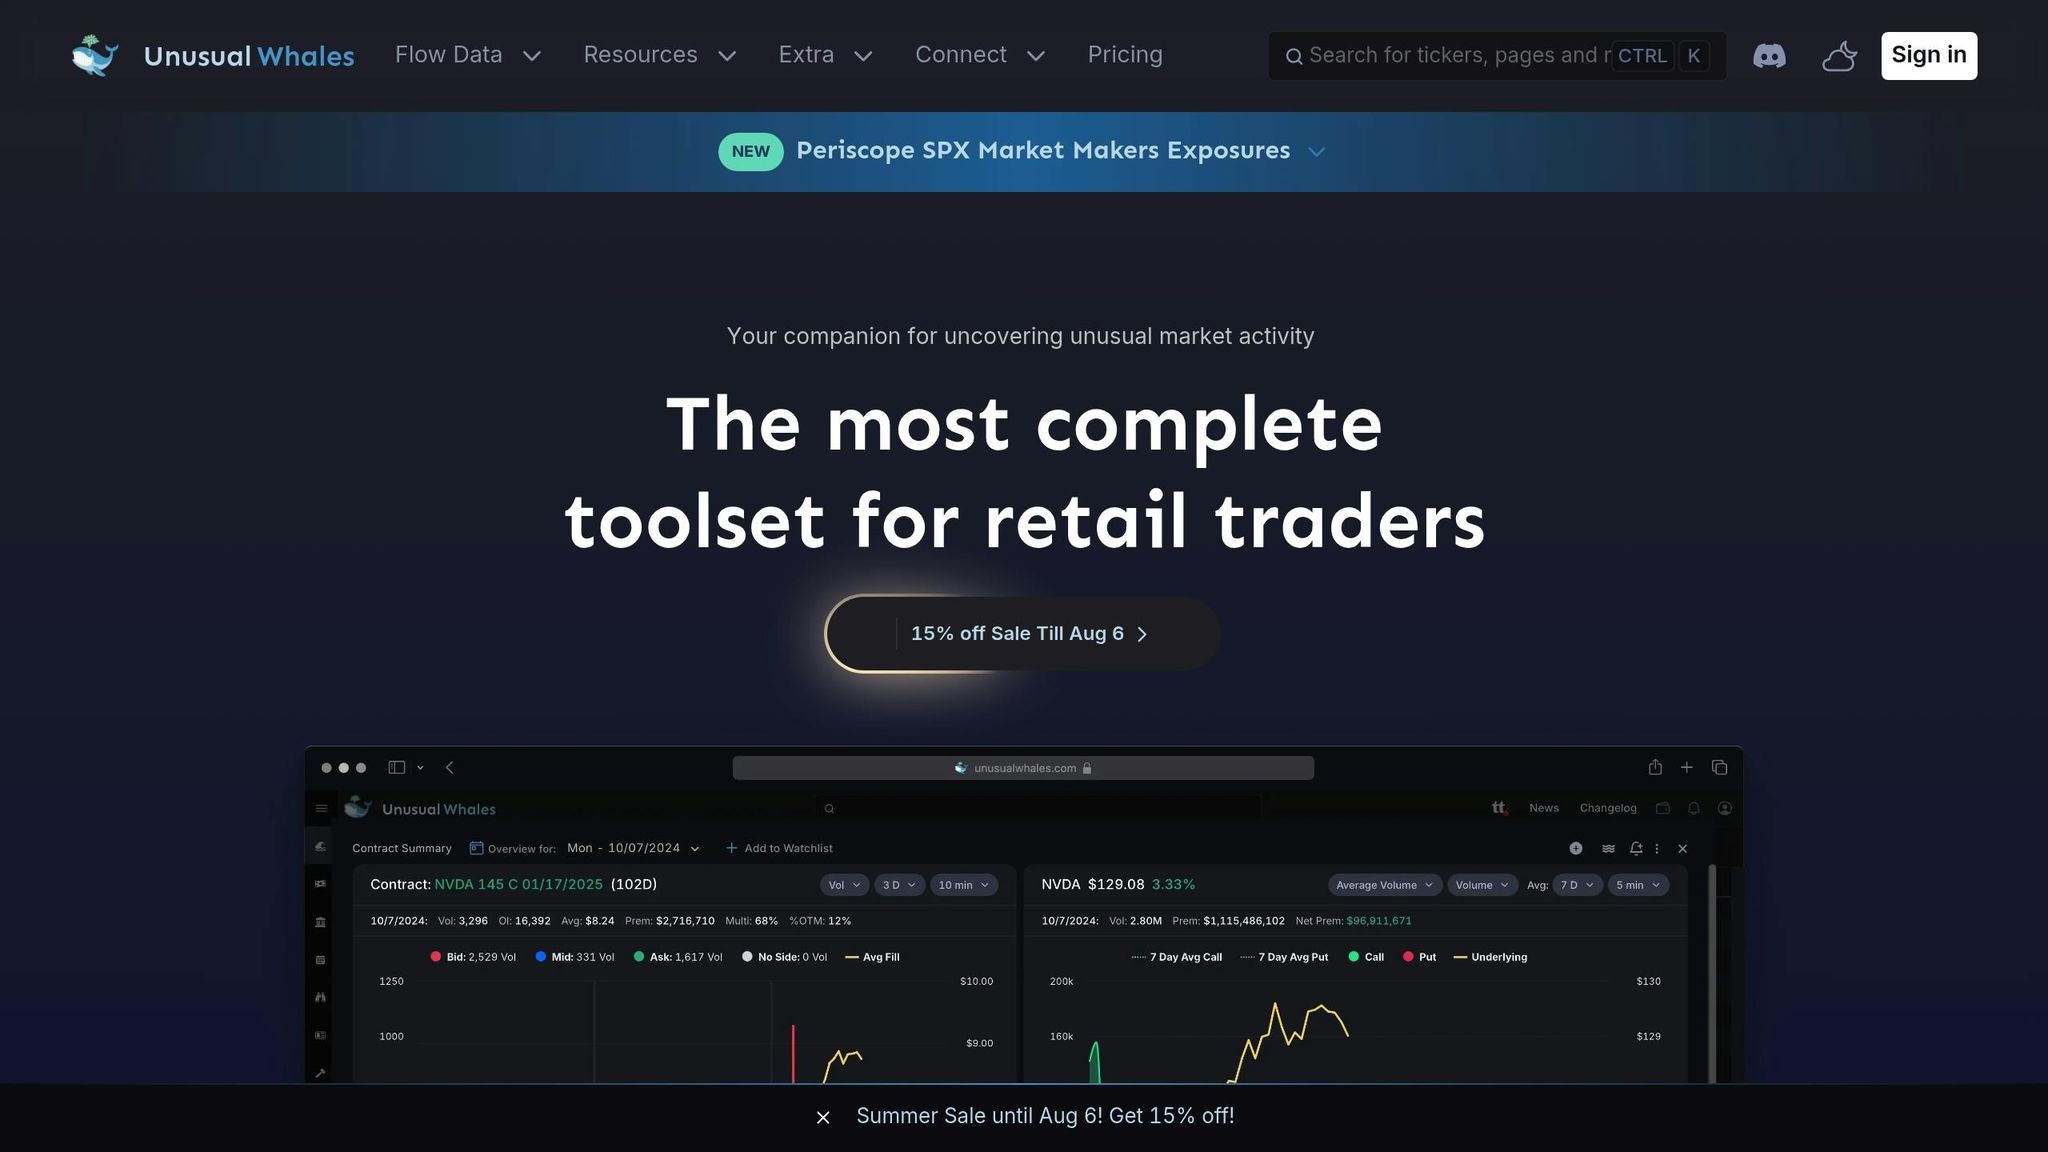
Unusual Whales offers real-time options flow data that tracks institutional trades, dark pool activity, and unusual trading patterns on U.S. exchanges. This platform provides retail traders with access to data typically reserved for institutional players, uncovering potential opportunities. The real advantage lies in correctly interpreting these signals and combining them with other analytical tools.
The Unusual Whales Scanner monitors activity across U.S. exchanges, delivering insights into significant market movements. When traders know how to read these signals and pair them with additional tools, this data becomes a powerful resource.
Key Features of Unusual Whales Data
Unusual Whales tracks several key metrics that help traders spot major market activity. One of these metrics is premium size, measured in USD, which reflects the amount of money being placed on trades. If 30–40% of this volume occurs in dark pools, it often signals substantial institutional involvement.
Other important metrics include contract volume, which shows how many options contracts are being traded, and expiration dates, which indicate the time horizon over which price movements are anticipated. The platform also analyzes volume relative to open interest, helping traders distinguish between new and closing positions.
Unusual Whales provides real-time alerts, customizable screeners, and sentiment indicators. Traders can filter data by trade type, sector, expiration date, and volume thresholds, honing in on the most relevant opportunities. For added convenience, the platform offers preset scanners like "Unusually Bullish", "Deep Conviction Calls", and "Long-Term Calls" to simplify the process of identifying specific trading setups. By aggregating individual trades, the platform creates a comprehensive view of each contract, making it easier to spot patterns.
These metrics form the backbone of understanding significant market shifts.
Common Signals and Their Meanings
Sweep orders are one of the most telling signals. These orders represent aggressive buying or selling, where traders pay premium prices to secure large positions quickly across multiple exchanges. Such activity often indicates urgent institutional positioning ahead of anticipated price changes.
Block trades, which are large off-exchange transactions, also reveal institutional activity. If these trades occur on the ask side, they generally suggest bullish sentiment, while bid-side executions point to bearish positioning.
Large premium trades are another critical signal, especially when volume exceeds open interest. For instance, on April 26, 2024, traders noticed unusual activity in TSLA $210 calls expiring June 21, 2024. Within just five minutes, 11,698 contracts were traded, compared to an open interest of 9,292, hinting at the establishment of new positions.
"Although none of these trades had a SIZE greater than OPEN INTEREST, the total volume transacted in that time interval quickly overtook the Open Interest; we can hypothesize that this is a new position due to the nature of the fills. It's not a GUARANTEE that all were opening trades, but it does seem much more likely than position closures." – Unusual Whales Team
Ask-side executions are often linked to bullish intent, as buyers are willing to pay higher prices to secure positions. For example, on April 22, 2024, 5,000 contracts of BSX $67.50 calls were executed on the ask side at $2.10 per contract, signaling institutional interest. To add context, the platform uses bullish and bearish volume bars, which are based on fill prices compared to the National Best Bid and Offer (NBBO) at the time of execution.
Understanding these signals provides a clearer picture of institutional strategies and helps refine trading decisions.
Benefits of Using Options Flow Data
Options flow data offers a unique advantage by providing forward-looking insights that reflect current institutional expectations, rather than relying on historical price trends. This makes it a valuable tool for timing trades and gauging market sentiment.
For instance, in March 2024, Unusual Whales flagged significant activity in Boston Scientific Corporation (BSX) options. A total of 3,140 contracts for $67.50 calls expiring May 17, 2024, were filled at $2.17 each. Following strong earnings on April 24, 2024, BSX stock climbed from $68.96 to $73.97, and the options surged to $7.10, delivering a 227% return.
The platform also helps traders identify trends from large trades, detect anomalies in trading activity, and take advantage of market sentiment. By monitoring trades from major institutional players, retail traders can gain insights into effective strategies and positioning.
Timing is another critical benefit. On April 11, 2024, as Apple (AAPL) broke through $169, a trader purchased 1,000 contracts of the $185 call expiring May 3, 2024, at $0.65 per contract. As AAPL's price continued to rise, the trader added to the position and exited between 2:30 and 2:35 PM when the contracts reached $1.30, securing an 88.4% profit.
Combining options flow data with dark pool insights provides a fuller picture of institutional activity. This dual approach helps traders develop stronger strategies by understanding both public options positioning and private institutional volume flows.
How to Combine MenthorQ Levels and Unusual Whales Data
Blending MenthorQ gamma levels with Unusual Whales options data can help pinpoint promising trade setups before committing your capital. Here's how these tools work together: MenthorQ's gamma levels highlight areas where dealer hedging might drive volatility or stabilize prices, while Unusual Whales provides real-time insights into institutional options trading. When these signals align, they can reveal potential market turning points. Let’s break down how to integrate these insights effectively.
Step-by-Step Process for Trade Confluence
-
Identify High Gamma Zones:
Start by using MenthorQ to locate high gamma zones - areas likely to experience volatility spikes or gamma squeezes, especially near option expiry dates. These zones often act as key support and resistance levels, driven by dealer positioning. Mapping these areas can help you understand where price action might intensify. -
Overlay Market Context:
Add another layer to your analysis by considering macroeconomic events, such as central bank announcements, alongside gamma levels. These broader factors can amplify the volatility hinted at by high gamma zones, helping you better time your trades. -
Confirm with Unusual Options Activity:
Use Unusual Whales to scan for unusual options activity that aligns with your MenthorQ gamma signals. Focus on key metrics like ask percentage, premium values, and time intervals to track large institutional trades. For example, sweep orders or block trades near a high gamma zone could confirm institutional positioning for expected volatility. Ask-side activity near resistance may suggest bullish sentiment, while bid-side action near support may indicate bearish pressure. -
Utilize Low Gamma Zones for Risk Management:
Low gamma zones, characterized by reduced dealer hedging activity, often experience less volatility. These areas can be ideal for range-bound trades or setting stop-loss levels. -
Incorporate Dark Pool Data:
Monitor dark pool activity using Unusual Whales to validate your trade direction. If dark pool volumes confirm your gamma level analysis, it strengthens the case for your trade setup.
Trade Confluence Examples
Let’s look at a couple of examples to clarify how these tools work together:
- Suppose MenthorQ highlights a high gamma zone near a resistance level on a major tech stock as an options expiry date approaches. Meanwhile, Unusual Whales detects significant call option volume purchased on the ask side. This alignment suggests a bullish setup, particularly if the stock price hovers near the identified gamma level.
- In another case, MenthorQ identifies a low gamma zone for a financial stock, indicating potential price stability. If Unusual Whales shows block trades in both calls and puts within this range, it signals an institutional range-bound strategy. This setup could support a neutral trading approach with clear risk parameters.
Risk Management Tips
To protect your trades when combining MenthorQ and Unusual Whales insights, consider these strategies:
-
Set Price Alerts:
In volatile zones, use price alerts instead of hard stops to avoid premature exits. -
Adjust Position Sizes:
Base your position size on order book trends and overall market conditions. -
Smart Stop-Loss Placement:
Avoid placing stops near psychological price levels or gamma-heavy zones. Low gamma areas can serve as natural stop-loss points. -
Confirm with Dark Pool Data:
Keep an eye on dark pool activity to ensure institutional flows align with your analysis (see Step 5 above). -
Follow Regulatory Rules:
For U.S.-based accounts, stay compliant with Pattern Day Trader (PDT) rules, which require a minimum equity of $25,000 for accounts executing more than three day trades within five business days. -
Account for Time Decay:
When combining options flow data with gamma levels, remember to factor in the time decay of options contracts. -
Validate Across Timeframes:
Cross-check your signals across multiple timeframes to confirm their reliability.
sbb-itb-2e26d5a
How Best Investing Tools Directory Helps with Trade Confluence
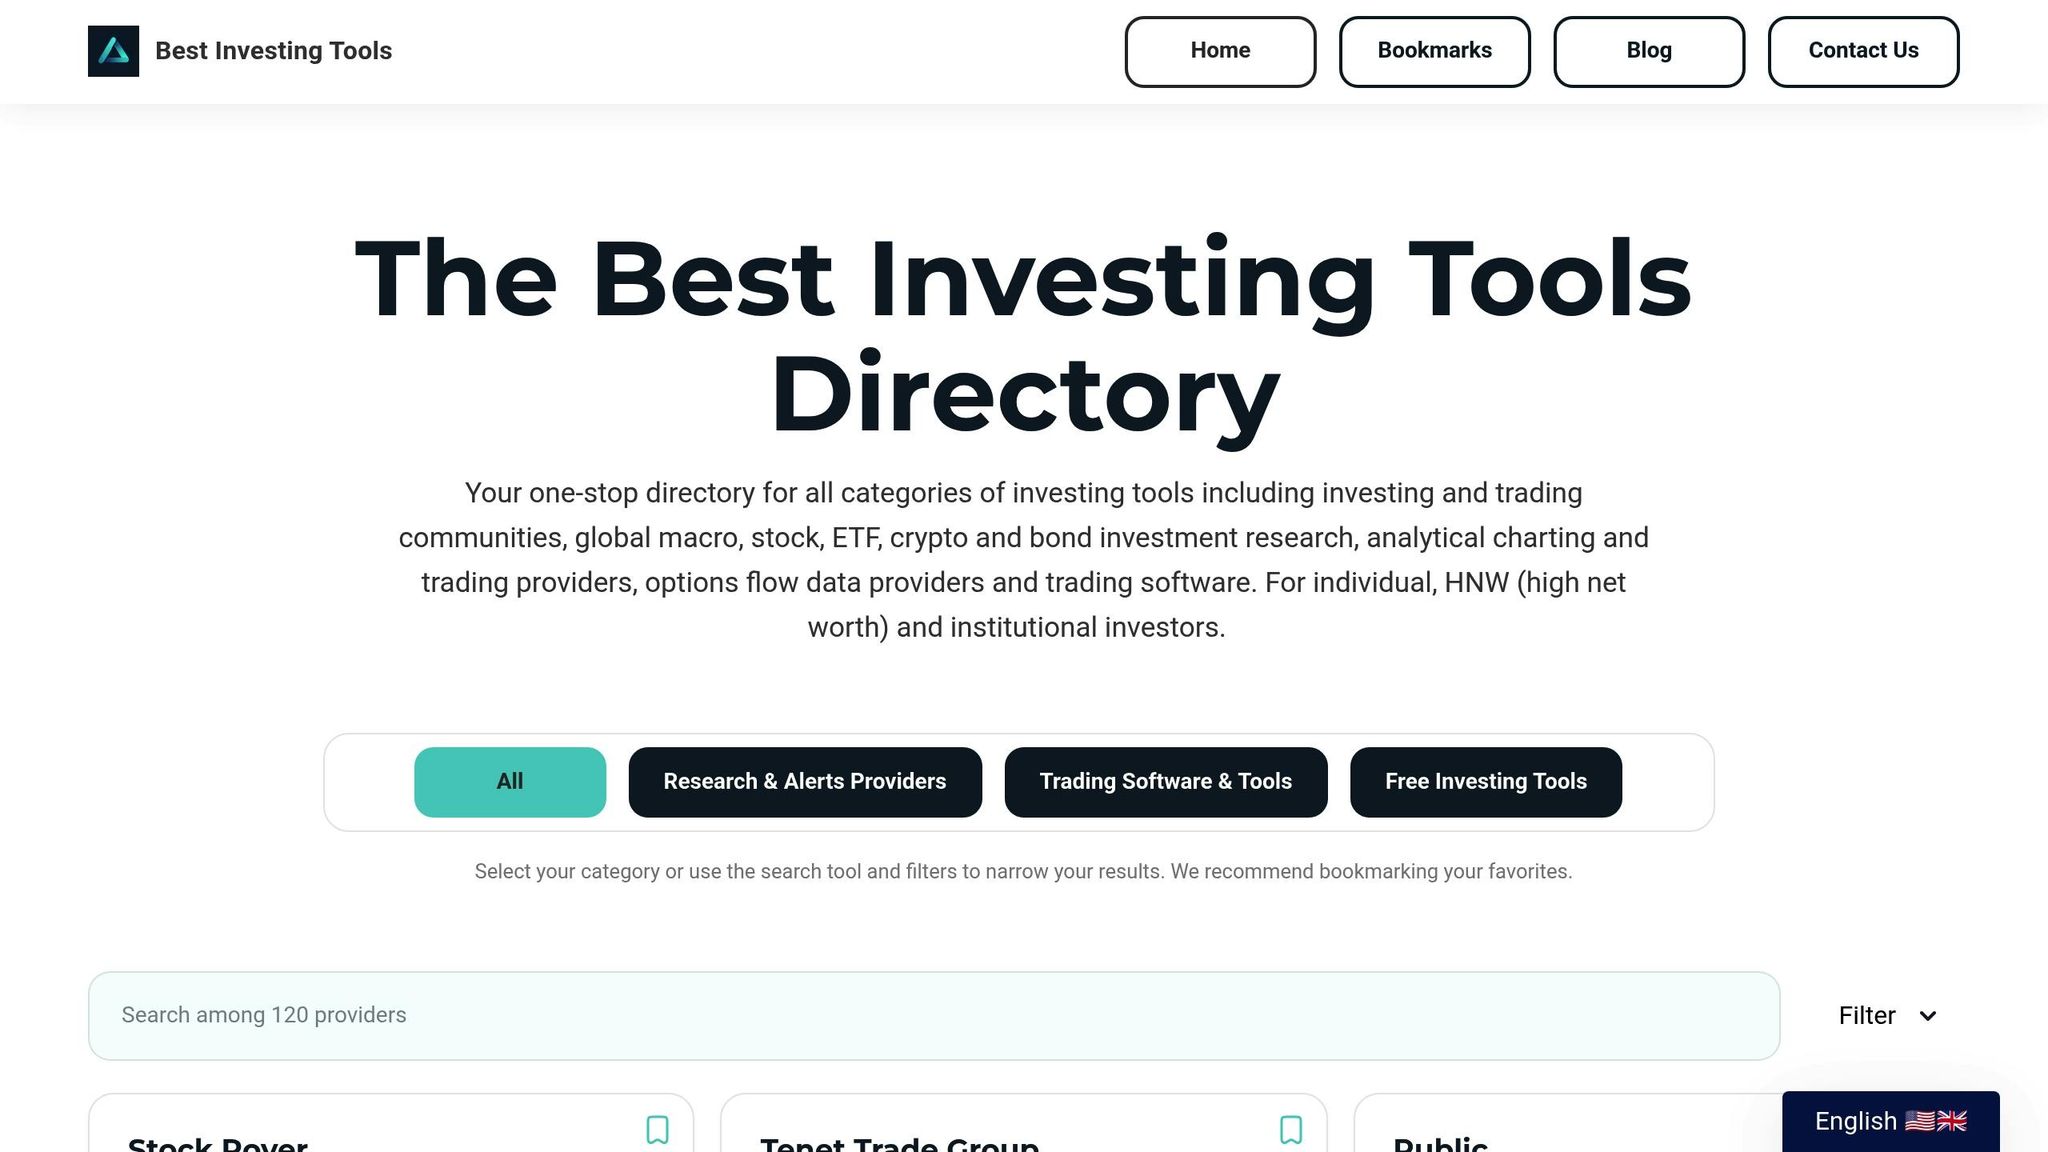
Expanding on the trade confluence strategies discussed earlier, the Best Investing Tools Directory simplifies the process of finding essential tools. Picking the right combination of trading tools can feel overwhelming, but this directory makes it easier.
By offering curated reviews, it helps traders streamline market monitoring and manage risks effectively. This centralized resource connects you to tools designed to enhance your trade confluence strategies.
Features of Best Investing Tools Directory
The Best Investing Tools Directory makes it simple to choose tools that work together for trade confluence. With user reviews and filtering options, traders can quickly find tools tailored to their specific needs.
The directory’s filters allow you to compare platforms for options data, technical analysis, or gamma indicators.
User feedback provides real-world insights into how tools like MenthorQ and Unusual Whales perform. Traders share details about data accuracy, reliability during volatile markets, and how well these tools integrate into existing setups.
MenthorQ vs Unusual Whales Feature Comparison
Here’s a side-by-side comparison of MenthorQ and Unusual Whales, two platforms popular among U.S. traders. This breakdown highlights the key differences, helping you decide which tool aligns best with your trade confluence strategy:
| Feature | MenthorQ | Unusual Whales |
|---|---|---|
| Primary Focus | Gamma levels and dealer positioning | Options flow and unusual activity tracking |
| Data Type | Technical analysis based on options gamma | Real-time options transactions and dark pool data |
| Best Use Case | Identifying volatility zones and support/resistance | Tracking institutional sentiment and large trades |
| Market Coverage | U.S. equities and major ETFs | Comprehensive U.S. options markets |
| Real-time Data | Yes | Yes |
| Mobile Access | Platform dependent | iPhone, iPad, and Android apps available |
| API Access | Varies by plan | Available |
| Pricing | Varies by subscription tier | $30 per month |
| Customer Support | Standard business hours | Business hours, live rep (24/7), and online support |
MenthorQ focuses on gamma-based analysis, offering insights into how dealer hedging may shape price movements around key levels. This technical perspective pairs well with Unusual Whales, which provides flow-based insights to track institutional sentiment and large trades. Together, they can create a strong foundation for trade confluence strategies.
Using the Best Investing Tools Directory, traders can go beyond surface-level comparisons. The platform offers detailed reviews and community feedback, helping you evaluate factors like cost, user experience, integration capabilities, and market suitability. This ensures you pick tools that align with your trading goals and budget.
Conclusion
Pairing MenthorQ levels with Unusual Whales options data creates a solid framework for U.S. traders seeking high-confidence trade setups. This combination ties gamma-derived support and resistance levels to real-time options flow, offering a structured way to identify opportunities with greater precision.
These tools work together to tackle a common trading challenge: confirming signals before risking capital. MenthorQ highlights key price levels like High Vol Levels and Put Support, while Unusual Whales provides insights into institutional options activity in real time. When both tools align, traders can define clear risk parameters, making trade execution more confident and calculated.
For risk management, consider placing stop-losses below Put Support or above Call Resistance. Use Unusual Whales data to time entries effectively. This disciplined approach helps protect against losses while positioning for potential gains.
The growing adoption of institutional-style strategies among retail traders underscores the value of combining technical levels with options flow analysis. As gamma-based methods and options flow data become more accessible, traders who excel at merging these elements will stand out in identifying market-moving opportunities early.
To streamline your strategy, the Best Investing Tools Directory offers a curated list of resources to help you implement trade confluence efficiently. Instead of spending time researching platforms, you can focus on refining your approach with tools trusted by the trading community.
Success in trade confluence demands ongoing adjustments. Markets shift, and the relevance of specific levels or patterns may evolve. Regularly reviewing your trades and exploring updates through resources like the Best Investing Tools Directory can help you stay ahead.
FAQs
How can traders combine MenthorQ levels with Unusual Whales options data to improve their trade decisions?
Traders can take their strategies to the next level by combining MenthorQ gamma levels with Unusual Whales options data. MenthorQ gamma levels pinpoint crucial market zones, such as support and resistance areas, where price reversals or breakouts are more likely to occur. These zones often indicate spots where market makers might step in.
On the other hand, Unusual Whales provides insights into significant options flow, like spikes in zero-DTE (same-day expiration) options volume. By cross-referencing this data with MenthorQ's gamma levels, traders can uncover a confluence of signals, offering stronger confirmation for potential trade setups. Using this combination, traders can make sharper decisions and stay ahead of market moves.
What are the challenges of using MenthorQ levels, and how can traders address them effectively?
Understanding the Limitations of MenthorQ Levels
MenthorQ levels are undeniably a valuable tool, but they do come with certain limitations. For instance, they might not fully capture the nuances of market maker hedging activities or the effects of sudden liquidity shifts. This can leave traders with an incomplete picture of the market. Moreover, relying solely on these levels without factoring in broader market sentiment or options flow data can heighten risks, especially in volatile trading environments.
To navigate these challenges, traders should consider using MenthorQ levels alongside other tools like options flow analysis and sentiment indicators. These additional data points can provide a more comprehensive market view. On top of that, a solid risk management strategy is crucial. This helps traders stay flexible in the face of shifting market conditions and minimizes exposure to unexpected risks. By combining multiple sources of information, traders can make better-informed decisions and increase their chances of executing successful trades.
How can Unusual Whales options flow data help retail traders understand institutional activity, and why does it matter?
Unusual Whales options flow data sheds light on significant, out-of-the-ordinary trades and block orders often executed by institutional investors or major market participants. These trades can offer insights into their strategies or expectations regarding upcoming price movements.
For retail traders, this information can be incredibly useful. It acts as an early indicator of potential market trends, giving them a chance to align their strategies with the actions of larger players. By doing so, retail traders can make more informed decisions and spot opportunities with higher chances of success.
