As financial markets evolve, so do the tools used to navigate them. TradingView has emerged as one of the most versatile and powerful platforms for charting and analysis. Whether you're a seasoned trader fine-tuning your strategies or a beginner trying to understand price movements, this guide will help you maximize TradingView's capabilities. Drawing on insights from a detailed video tutorial, we’ll take you step by step through the platform’s essential features, customization tools, and advanced functionalities.
Why TradingView?
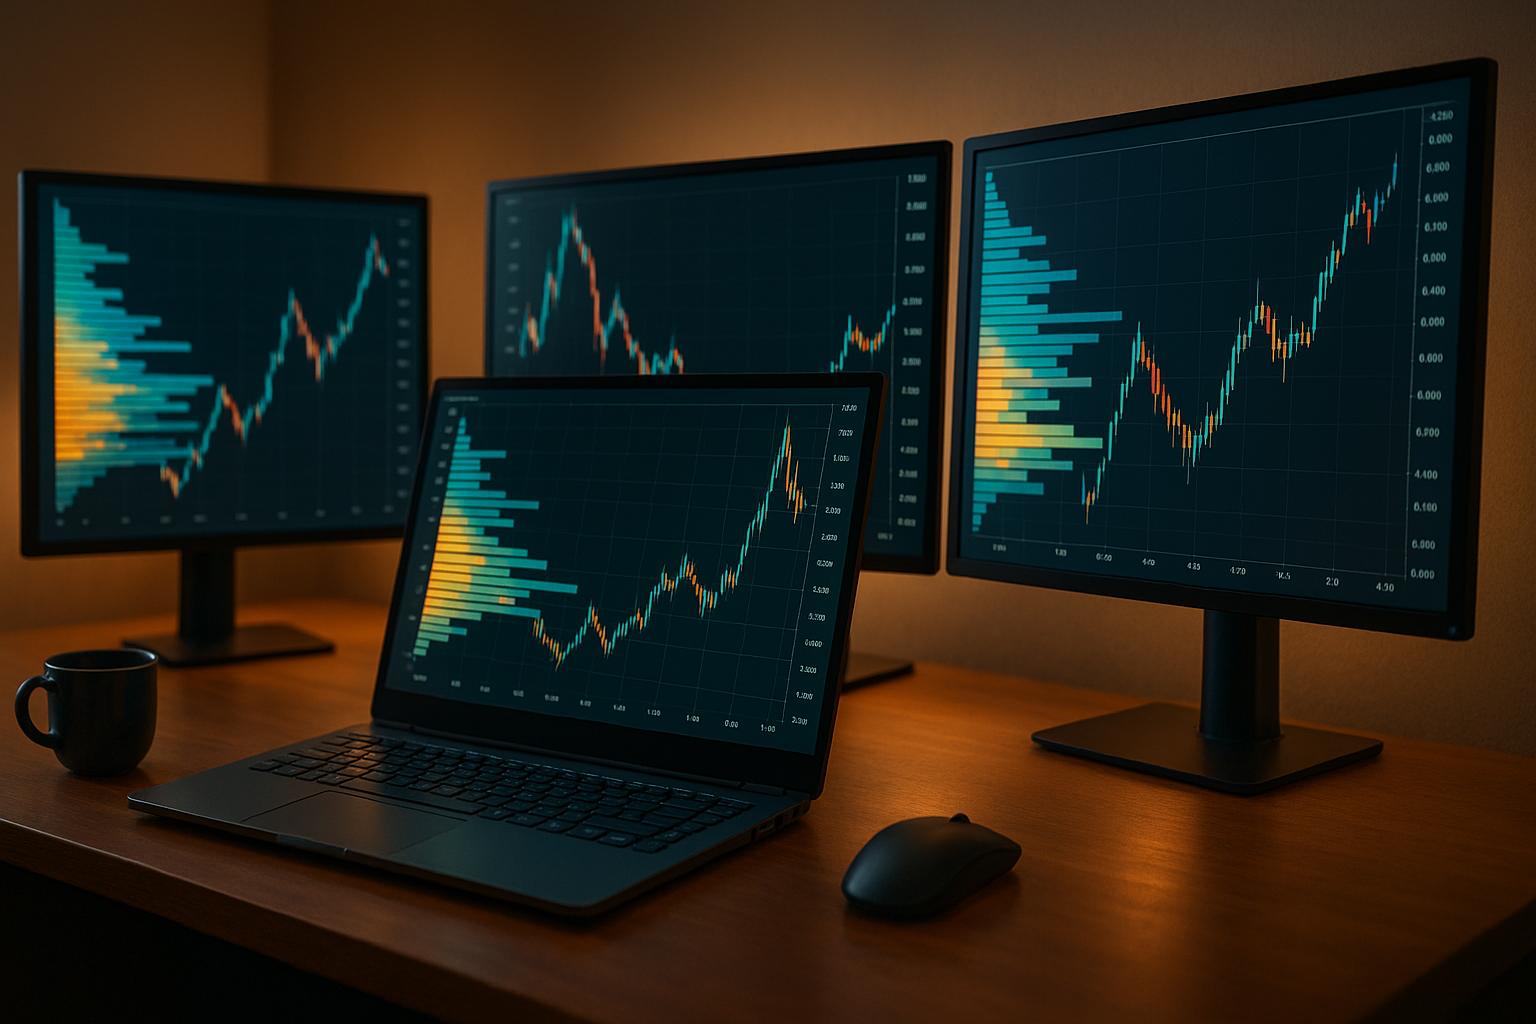
TradingView is widely regarded as a premier charting platform due to its robust feature set, intuitive interface, and multi-market coverage. From stocks to cryptocurrencies, forex to futures, it offers traders and investors real-time data and valuable tools, all in one place. The platform's adaptability makes it suitable for both beginners and experienced professionals looking to streamline their workflows.
By the end of this guide, you’ll know how to set up TradingView, customize it for your needs, and use its advanced features to analyze markets like a pro.
Getting Started: Account Creation and Setup
-
Creating Your Account
To begin using TradingView, visit their homepage at tradingview.com. Click the "Get Started" button in the top-right corner. You’ll have various options to sign up - Google, Facebook, email, or other methods. Using your email is often recommended for better organization. Once you’ve signed up and verified your email, you’ll be ready to dive in. -
Navigating the Homepage
When you first log in, you’ll land on the TradingView dashboard. This includes a market overview, tabs for products, news, a community section, and other features to explore. Spend some time familiarizing yourself with these components as they’ll be integral to your trading workflow. -
Pro Tip: Download the Desktop App
While the browser version of TradingView is excellent, the desktop application offers a cleaner and more responsive experience. It's available for Windows, Mac, and Linux.
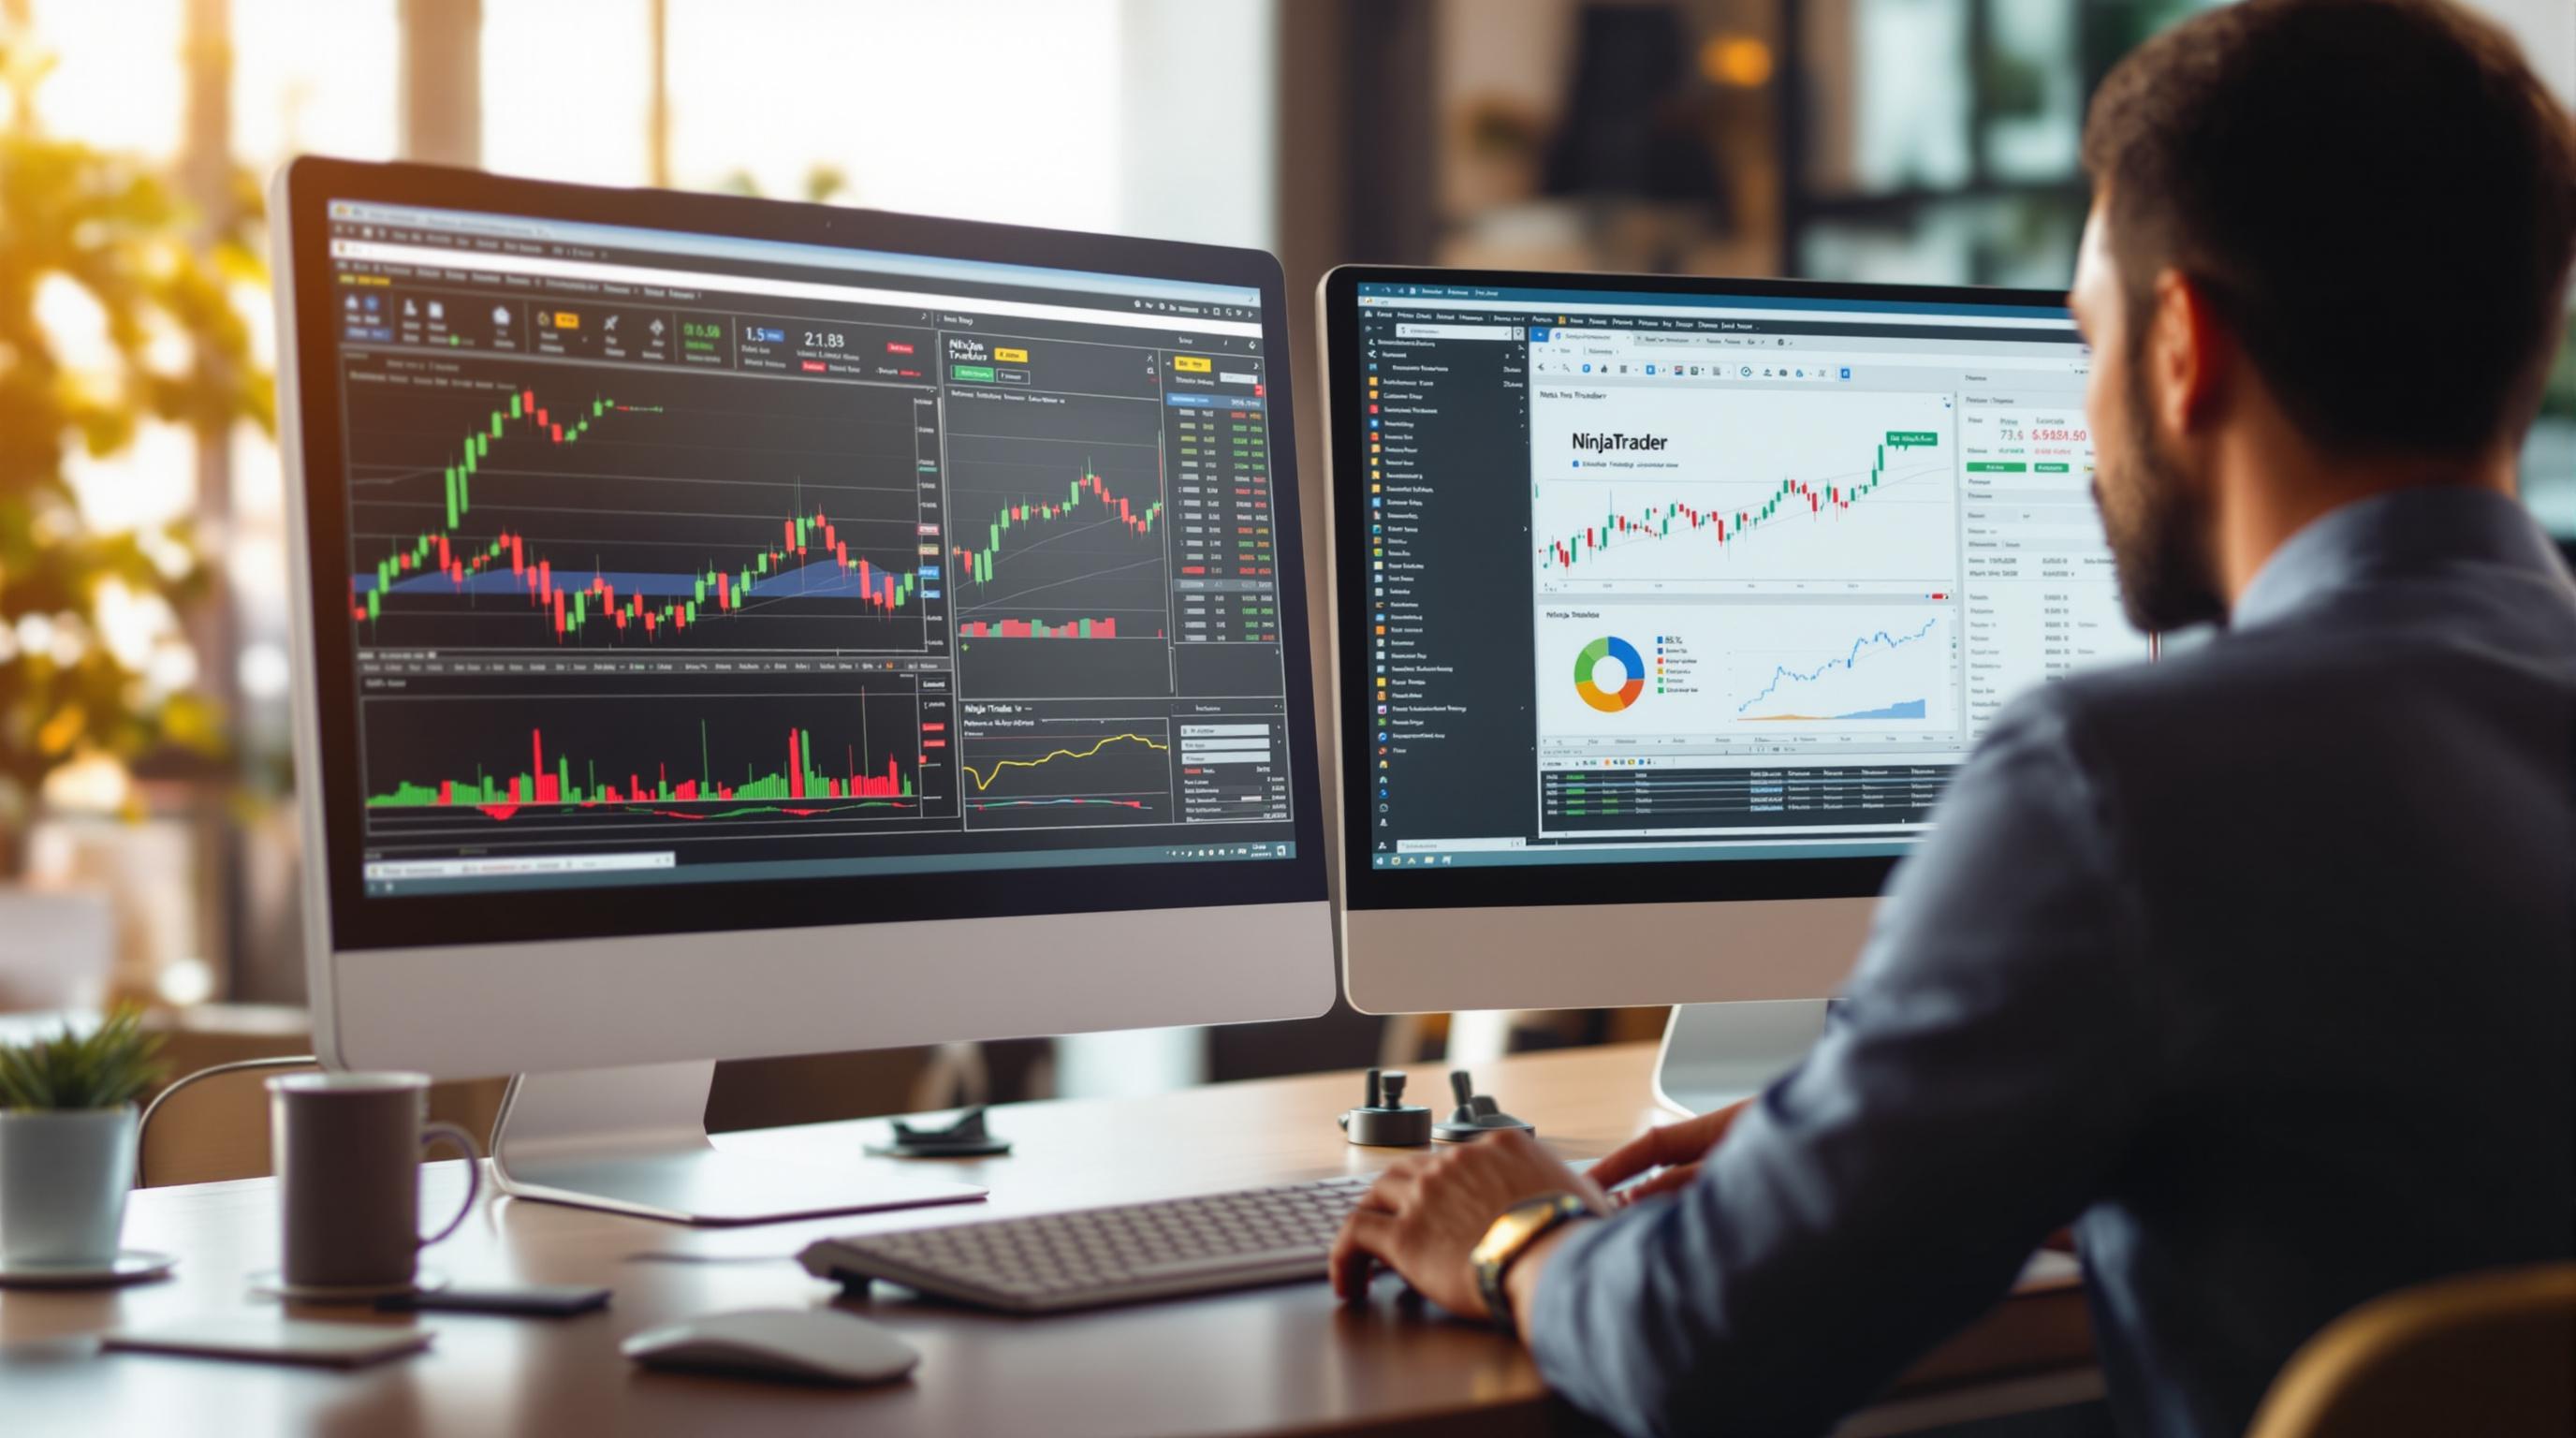
Customizing Your Chart Layout
TradingView’s visual customization options make it stand out. A well-optimized chart is essential for efficient analysis, so let’s walk through key customization steps:
-
Switch to Dark Mode
Navigate to your profile icon in the upper left corner and select "Dark Theme." This reduces eye strain during long trading sessions. -
Adjust Chart Colors
Go to Settings → Chart Settings → Symbol to customize candlestick colors and styles. For example:- Bullish candles can be set to white for clarity.
- Bearish candles can be orange or another vibrant color to signal price drops clearly.
-
Simplify Your Background
A solid, neutral background (accessible via the Appearance tab) helps reduce distractions. Consider turning off grid lines or reducing their opacity for a cleaner look. -
Save Your Preferences
Once you’ve customized your layout, save it as a template for easy reuse. This is especially useful if you switch between different chart types (e.g., candlesticks, line charts, Heikin Ashi).
Navigating the Chart
TradingView offers intuitive controls to help you interact with your charts seamlessly:
-
Zoom and Pan
- Use your scroll wheel to zoom horizontally.
- Drag the price axis (on the right) to zoom vertically.
- Click and drag on the chart to move around freely.
-
Auto and Log Modes
- Auto Mode: Keeps the chart zoomed on the latest price action. Disable it if you want full control.
- Log Scale: Ideal for analyzing long-term trends with large price movements (e.g., historical Bitcoin charts). Activate this for a clearer perspective on macro price shifts.
-
Time Frame Shortcuts
Simply type the time frame (e.g., "5" for 5-minute or "30" for 30-minute) on your keyboard and press Enter to switch instantly.
Essential Tools and Features
1. Indicators
Indicators transform raw price data into actionable insights. Here’s how to get started:
- Click the Indicators tab at the top of the screen.
- Add popular tools like the RSI (Relative Strength Index) for momentum analysis or Bollinger Bands for volatility insights.
- Explore community-created indicators for unique strategies, but stick to the basics while learning.
Pro Tip: Use the Favorites feature to quickly access your frequently used indicators.
2. Drawing Tools
TradingView offers various drawing tools for technical analysis. Here are some must-know options:
- Trend Line Tool: Identify support and resistance by connecting swing highs and lows.
- Fibonacci Retracement Tool: Locate potential reversal zones using natural retracement levels like 38.2% and 61.8%.
- Horizontal Line and Rectangle Tools: Mark areas of support and resistance as zones instead of perfect lines to account for variability.
Pro Tip: Use the Path Tool to visually map potential price movements for scenario planning.
3. Bar Replay Mode
Practice your strategies by replaying price action one candle at a time. This tool simulates live markets, allowing you to refine your decision-making without live risk.
4. Alerts
Set price alerts to stay updated without constant chart monitoring. Use the Add Alert feature to trigger notifications when price crosses specific levels or meets selected conditions. Alerts can be configured for both price action and indicator signals.
Workflow Optimization
1. Multi-Time Frame Analysis
Use TradingView’s multi-chart layouts to analyze the same market across different time frames (e.g., daily, 4-hour, and 1-hour charts side by side).
- Sync settings like symbols, intervals, and crosshairs for efficient comparisons.
2. Watchlists
- Create multiple watchlists for different strategies (e.g., swing trades, high-volatility pairs).
- Use color flags to categorize assets (e.g., green for actionable trades, yellow for potential setups).
3. Indicator Templates
Save your go-to indicator combinations (e.g., EMA + RSI) as templates for quick application across charts.
Advanced Tools
1. Paper Trading
The Paper Trading account allows you to simulate real trades with virtual funds.
- Reset your balance to match your risk tolerance (e.g., $20,000).
- Include simulated commission fees for realistic backtesting.
2. Broker Integration
If supported, connect your broker account directly to TradingView to execute trades and manage positions from within the platform.
Key Takeaways
- Customization Matters: Personalize your chart layout and save templates for better efficiency.
- Master Navigation: Use shortcuts like typing time frames or enabling/disabling auto mode for smoother chart control.
- Embrace Tools: Learn to use Fibonacci levels, trend lines, and indicators like RSI to enhance your analysis.
- Practice with Bar Replay: Simulate price action to refine strategies without real-world risk.
- Set Alerts: Stay ahead of market movements with custom notifications.
- Leverage Paper Trading: Build confidence and practice discipline using virtual funds.
- Organize Watchlists: Create categorized lists and flag assets to streamline your workflow.
- Multi-Chart Layouts: Use this feature for comprehensive multi-time frame or asset analysis.
Conclusion
TradingView is a powerful platform that caters to all levels of traders and investors. By mastering its features and customizations, you can significantly enhance your market analysis and decision-making. Take the time to explore its tools and integrate them into your trading routine. With consistent use, TradingView can become an indispensable part of your financial journey, empowering you to navigate the complexities of the markets with confidence and clarity.
Source: "How To Use TradingView For Beginners (FULL Tutorial 2025)" - Crypto Giant, YouTube, Sep 1, 2025 - https://www.youtube.com/watch?v=zmP1Fz3SJRs
Use: Embedded for reference. Brief quotes used for commentary/review.