Technical analysis is a data-driven approach to making investment decisions. Whether you're a beginner or a professional, the right platform can simplify this process by offering tools like advanced charting, real-time data, and customizable indicators. Here's a quick rundown of the top platforms:
- TradingView: Known for its fast charts, 400+ indicators, and flexible pricing (free to $199.95/month).
- Stock Rover: Ideal for long-term investors with 700+ metrics and robust screening tools ($7.99–$27.99/month).
- Quodd: Designed for professionals needing real-time market data and APIs (enterprise pricing).
- Koyfin: Offers deep macro and sector analysis with a free plan and premium options up to $79/month.
- YCharts: Tailored for advisors with client presentation tools ($300–$500/month).
- Morningstar Direct: Institutional-grade platform with custom pricing for asset managers.
- TipRanks: Combines technical analysis with expert insights (free to $49.95/month).
Each platform caters to different needs, from beginner-friendly tools to institutional-grade solutions. Below is a quick comparison to help you decide.
Quick Comparison
| Platform | Monthly Pricing | Best For | Key Features | Limitations |
|---|---|---|---|---|
| TradingView | $0–$199.95 | All trader levels | Fast charts, 100+ indicators | Advanced features require payment |
| Stock Rover | $7.99–$27.99 | Long-term investors | Screening tools, financial metrics | Fewer technical indicators |
| Quodd | Enterprise pricing | Professional traders | Real-time data APIs, reliability | High cost, complex setup |
| Koyfin | Free–$79 | Macro and sector analysis | Custom charts, economic data | Limited technical tools |
| YCharts | $300–$500 | Advisors | Presentation tools, deep insights | Expensive for individuals |
| Morningstar Direct | Custom pricing | Institutional investors | Portfolio modeling, risk analysis | Overkill for casual users |
| TipRanks | Free–$49.95 | All investor types | Expert insights, sentiment signals | Overwhelming for beginners |
Choose based on your trading goals, budget, and required features.
Which SOFTWARE to use for TECHNICAL ANALYSIS ?? #Learn2TradePro | Vivek Bajaj
1. TradingView
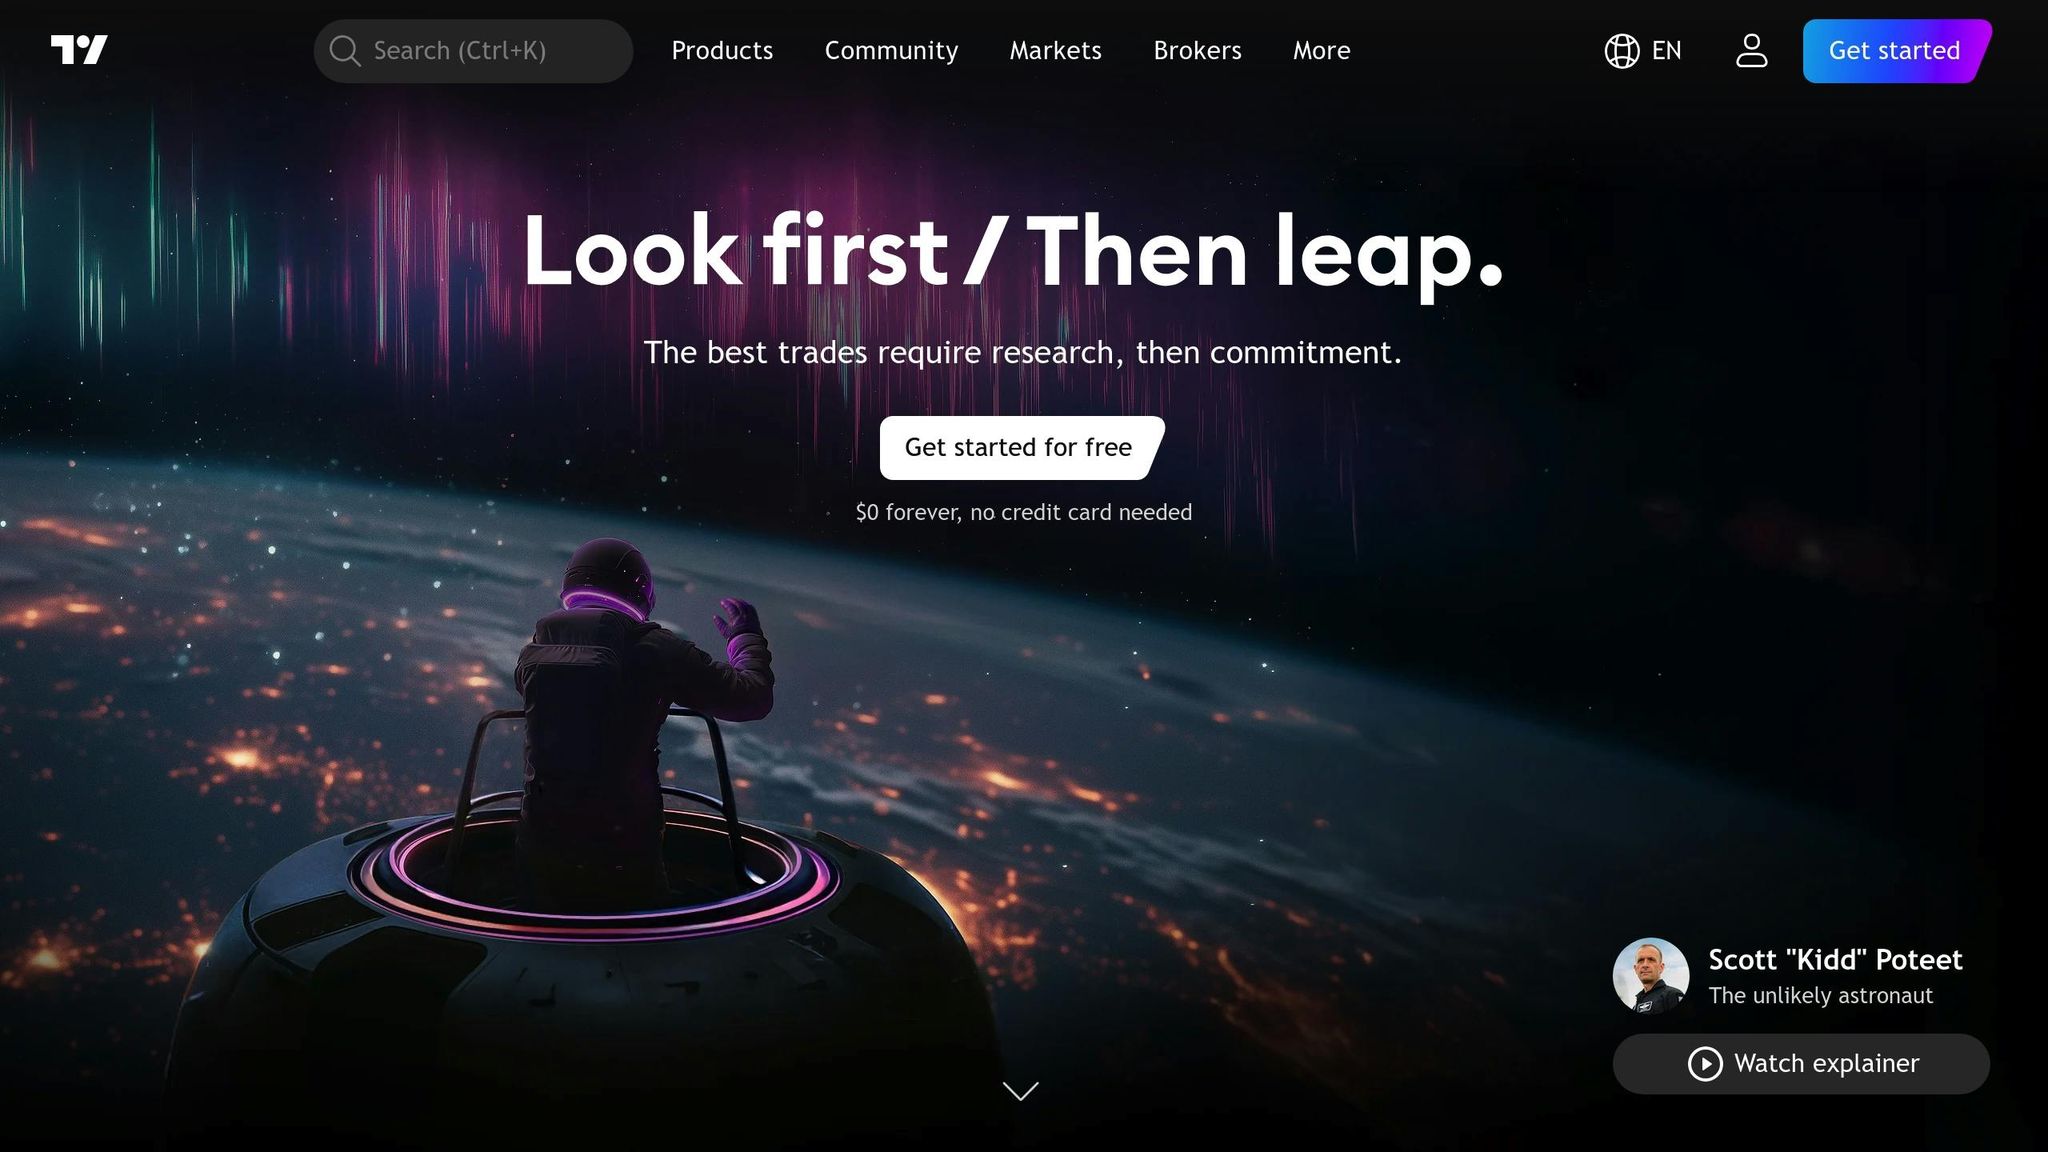
TradingView has become a go-to platform for technical analysis, trusted by over 100 million traders worldwide. It boasts charts that load three times faster than competitors and maintains an impressive 92% satisfaction rate.
The platform's advanced charting system offers more than 20 interactive chart types, including popular options like Candles, Heikin Ashi, Renko, Point & Figure, and Volume Candles. It also supports multi-timeframe analysis with customizable intervals, giving traders the flexibility they need.
When it comes to indicators, TradingView doesn’t disappoint. It provides over 400 built-in trading indicators and strategies, along with access to a massive library of 100,000+ public indicators created by the community. For those on higher-tier plans, up to 50 indicators can be applied to a single chart, enabling in-depth multi-factor analysis. Advanced tools such as volume footprint analysis, Time Price Opportunity visualizations, and session volume profile calculations add even more depth to the platform.
Traders can also take advantage of 110+ smart drawing tools to pinpoint support, resistance, and key price patterns. For those who like to customize their strategies, TradingView’s Pine Script™ allows users to create their own indicators and strategies.
The platform supports up to 1,000 price alerts on its Ultimate plan and offers robust screening tools for stocks, ETFs, bonds, and cryptocurrencies. These features are complemented by a flexible pricing structure designed to cater to different types of traders:
| Plan | Monthly Cost (Annual) | Charts per Tab | Indicators per Chart | Price Alerts |
|---|---|---|---|---|
| Basic (Free) | $0 | 1 | 2 | 3 |
| Essential | $13.99 | 2 | 5 | 20 |
| Plus | $28.29 | 4 | 10 | 100 |
| Premium | $56.49 | 8 | 25 | 400 |
| Expert | $99.95 | 10 | 30 | 600 |
| Ultimate | $199.95 | 16 | 50 | 1,000 |
TradingView goes beyond just charts and indicators. It integrates financial news and data, creating a comprehensive research environment. Its Technical Rating indicator, which uses 11 different technical signals to pinpoint entry and exit opportunities, is often praised as one of the most effective signal tools available. When paired with TradingView Premium and its specialized features, traders can elevate their technical analysis to the next level. With its lightning-fast charts, extensive indicator options, and collaborative features, TradingView is an excellent choice for both individual traders and institutional teams.
2. Stock Rover
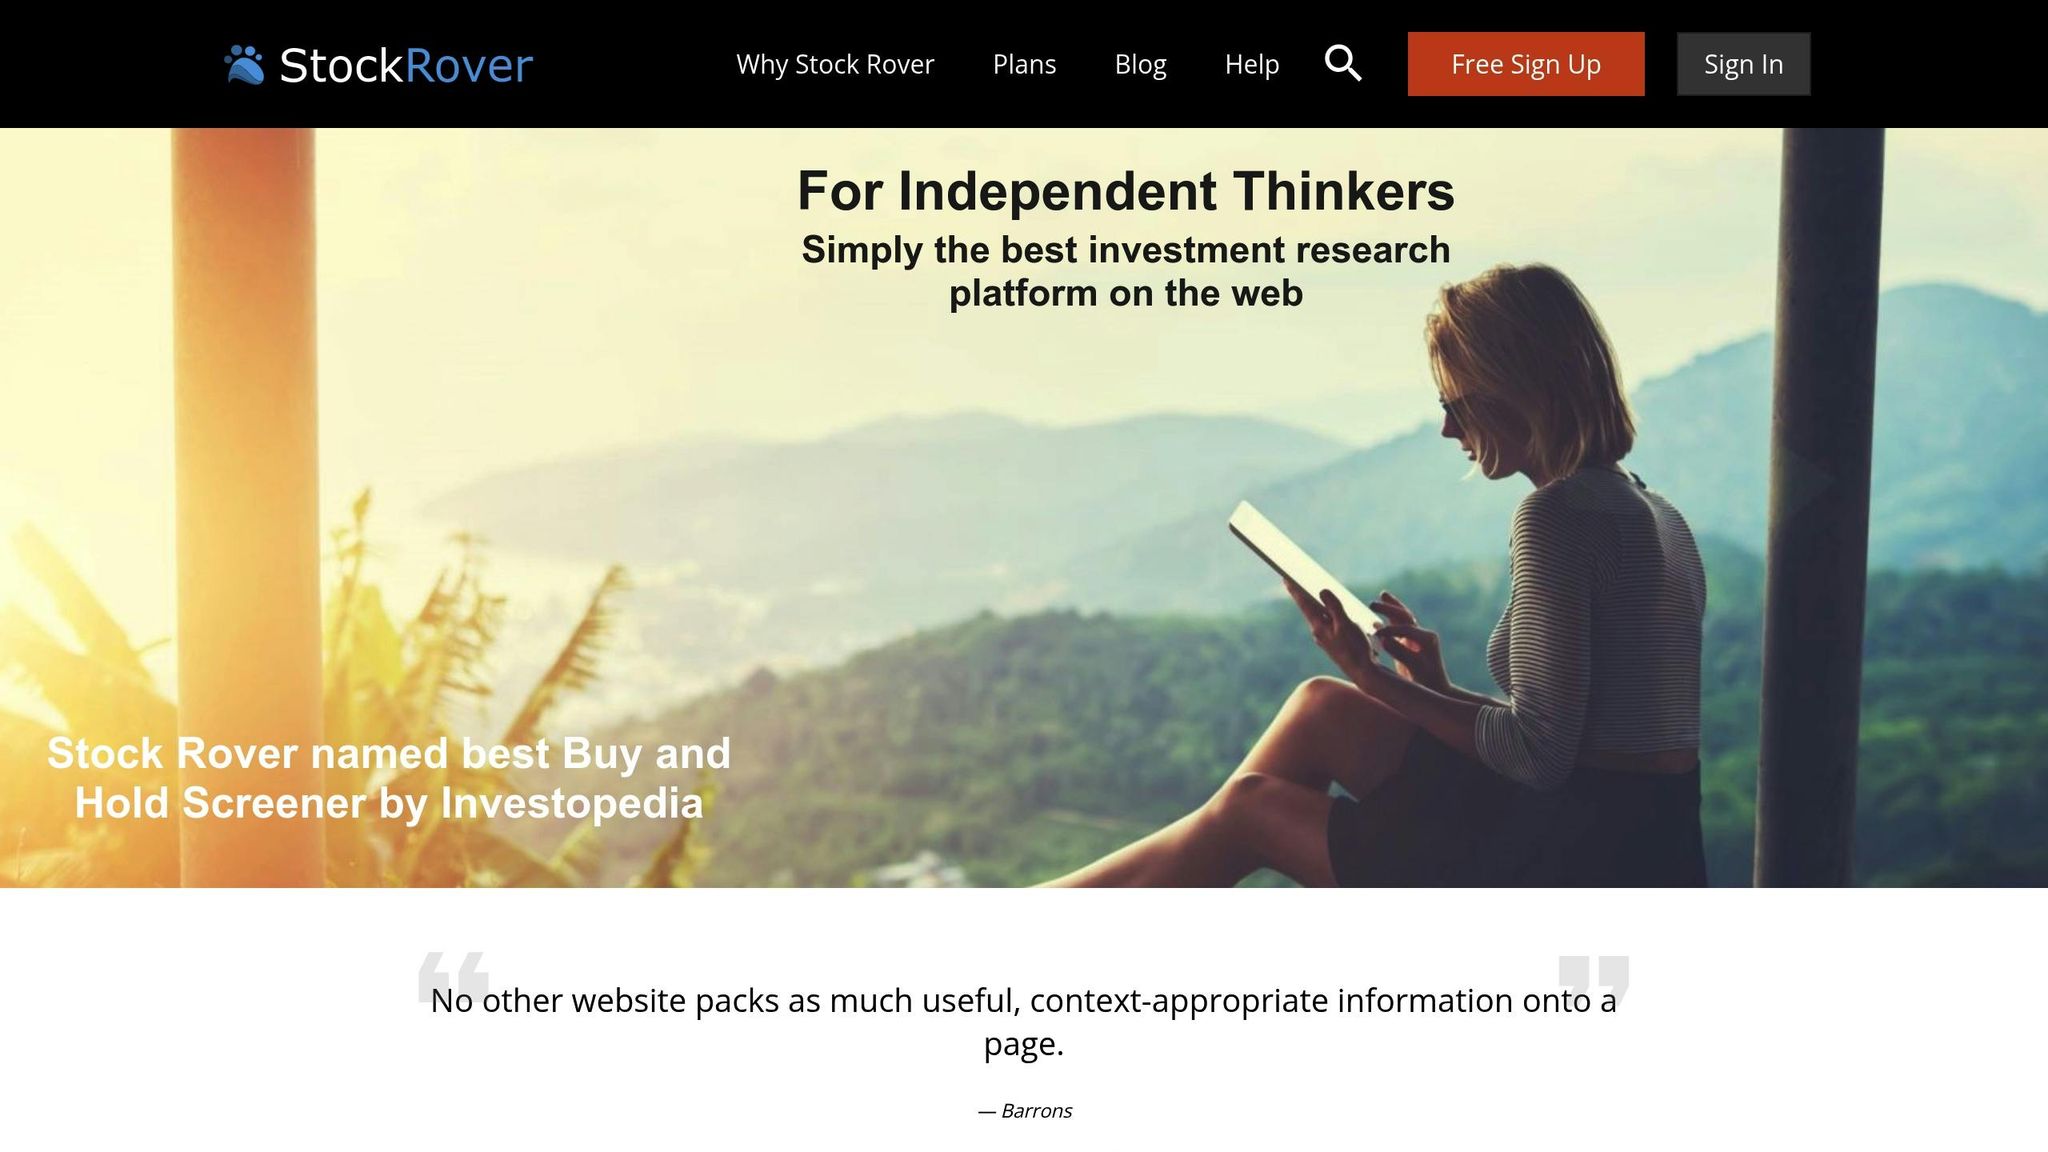
Stock Rover is a robust equity research platform that blends technical analysis tools with a database of over 700 financial metrics for more than 8,500 North American stocks. It's been recognized by Barron's for its depth and versatility. This strong foundation is evident in its diverse charting and analysis features.
The platform offers a wide range of charting options, including candlestick, OHLC, and logarithmic charts. Users can overlay dividends, events, technical indicators, or fundamental metrics on up to twelve charted lines. The "Set as a baseline" feature further allows for easy performance comparisons. Stock Rover’s technical indicator suite is equally impressive, featuring tools like simple moving averages, Bollinger Bands, MACD, RSI, exponential moving averages, Keltner Channels, and the Money Flow Index. Ratio charts also enable users to compare the performance of two datasets while plotting relevant technical indicators.
In a February 16, 2024 analysis, Microsoft (MSFT) was used to showcase the platform’s application of simple moving averages and Bollinger Bands, illustrating its ability to benchmark performance across different sectors [Stock Rover Blog, February 16, 2024].
Customization is one of Stock Rover’s standout features, thanks to its Visuals tool. This allows users to create personalized dashboard tabs with up to six vertically stacked tables and charts. Options include History, Peer Comparison, or Market Comparison tables, as well as Price, One Fundamental, or Multiple Fundamentals charts. Ken Leoni, VP of Marketing at Stock Rover, highlights the value of this flexibility:
"Customization lets you tailor Stock Rover so that you get the data you want to see, with the structure you want, and formatted the way you want to see it".
Stock Rover offers several pricing tiers to cater to different needs:
| Plan | Monthly | Annual | Two-Year |
|---|---|---|---|
| Essentials | $7.99 | $79.99 | $139.99 |
| Premium | $17.99 | $179.99 | $319.99 |
| Premium Plus | $27.99 | $279.99 | $479.99 |
The Premium Plus plan unlocks the platform's most advanced screening and charting tools, while the Premium plan includes 10 years of historical data, ETF screening, and multi-monitor support. Research Reports can be bundled with annual plans for an extra $49.99 or purchased separately for $99.99 per year.
"Stock Rover is the AAII – CI Editor's Choice", emphasizing its wealth of information and customization options.
Although some users find the interface complex, Stock Rover’s screening tools are a major strength. Investors can filter stocks and ETFs using over 500 criteria, making it a powerful resource for technical analysis and decision-making.
3. Quodd
Quodd provides real-time market data from over 150 global exchanges, boasting an impressive 99.999% uptime. Its Equity+ Securities Workstation is designed to deliver institutional-grade data feeds, supporting live charts and technical analysis for professionals.
The platform’s real-time APIs offer a rich array of market data, including streaming prices for global equities and ETFs, intraday tick data, and volume-weighted and time-weighted average prices (VWAP, TWAP). Technical analysts can access detailed market statistics, such as open, high, low, and close prices, along with chart bars and pre- and post-market quotes. With cloud streaming, live stock quotes are seamlessly delivered to servers, mobile devices, or web platforms, ensuring constant accessibility.
Quodd combines historical and real-time data, making it a powerful tool for trend analysis. Its APIs support multiple identifiers like symbols, ISIN, CUSIP, and SEDOL, while also offering composite market information, such as top movers, gainers, and losers. This setup enables thorough backtesting of trading strategies using historical quotes adjusted for corporate actions. By integrating both historical and real-time data, Quodd ensures scalability for a variety of use cases.
In 2024, Quodd's QX Marketplace handled over 9 trillion API requests, maintaining 99.9% availability across equities, ETFs, options, futures, and indices. This level of reliability is crucial for automated trading systems and custom applications that depend on uninterrupted data feeds.
One practical example of Quodd’s capabilities comes from a leading ETF intelligence provider. This firm uses real-time data from the QX Marketplace to power various modules on its website, efficiently filtering securities of interest and paying only for the data it consumes.
Quodd’s pricing model is tailored for enterprise clients, with costs depending on factors like asset class, data frequency (real-time, streaming, intraday, delayed, end-of-day, or historical), and the specific use case (public display, back office, or redistribution). The platform also offers custom data products in preferred formats for regional or global coverage. While public pricing isn’t available, interested clients can contact Quodd’s sales team for a personalized quote.
For developers and technical analysts building custom applications, Quodd’s cloud-native solutions provide flexible endpoint options, accommodating different data types, volumes, and frequencies. Additionally, the platform offers vendor of record (VOR) services, simplifying administrative tasks and reporting for institutional users.
4. Koyfin
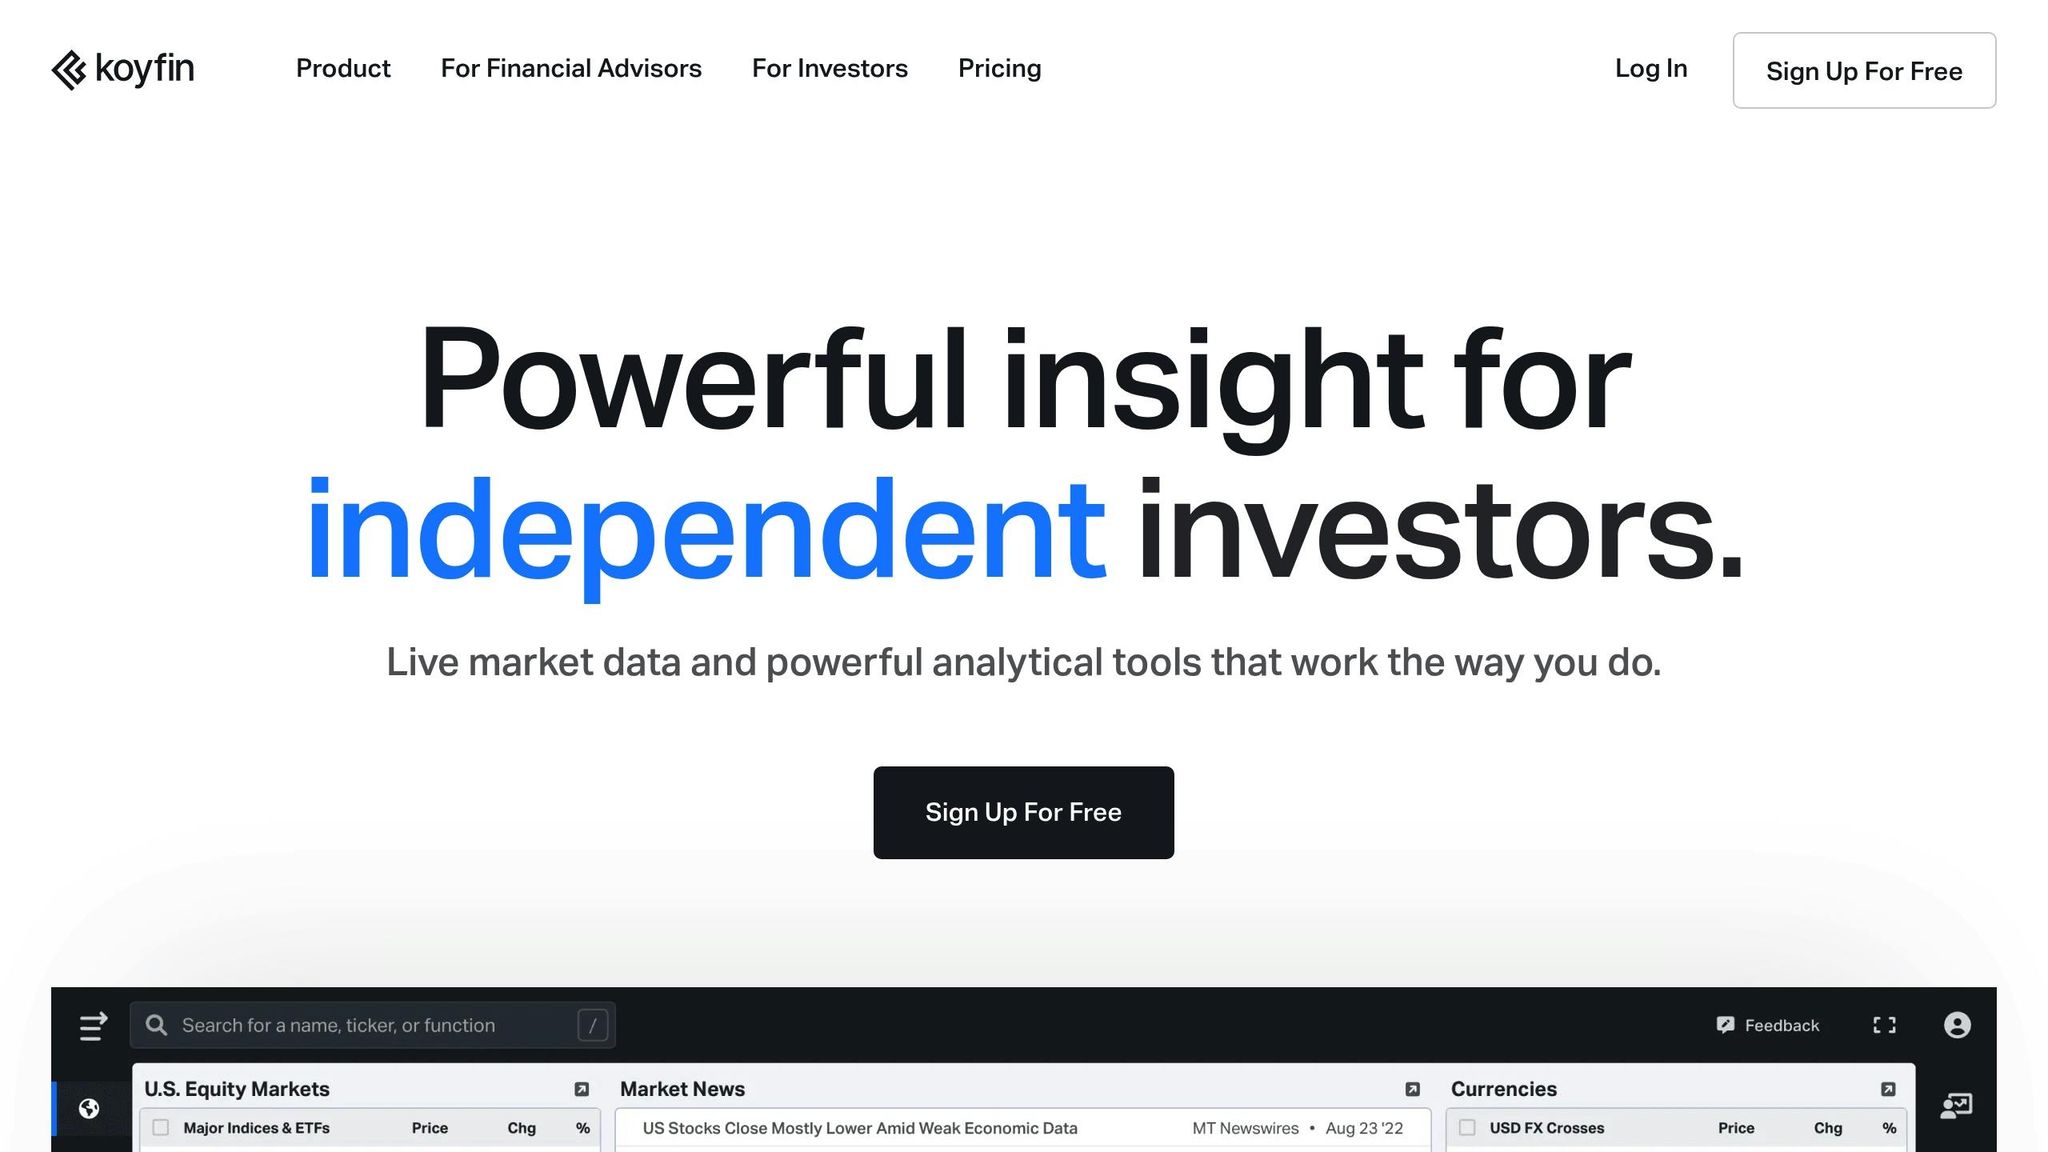
Koyfin offers sophisticated charting capabilities for over 100,000 global securities, including stocks, ETFs, mutual funds, forex, and bonds. With 30 years of historical data at your fingertips, the platform is designed for in-depth trend analysis and backtesting.
One standout feature is the Historical Graph (G) chart, which provides unmatched flexibility. Users can create custom visualizations from over 100 data series, covering areas like fundamentals, technical indicators, performance metrics, valuations, and analyst ratings. You can even apply transformations like year-over-year percentage changes and integrate statistical tools like mean and standard deviation bands.
For technical analysts, Koyfin includes a variety of drawing tools such as trend lines, Fibonacci retracements, and support/resistance levels. The platform supports multiple chart types - including candlestick and line charts - with adjustable time frames to suit different analysis needs. Advanced users can take it a step further by crafting custom formulas and performing correlation analyses to develop unique technical indicators.
Koyfin also excels in layout customization. With multi-pane layouts, the Data Overlay feature, and a template system, users can analyze multiple metrics side by side, layer economic indicators onto price charts, and save their configurations for future use . These features integrate seamlessly with Koyfin's powerful screening tools, making it a one-stop shop for detailed market analysis.
The platform's equity screener is another highlight, offering over 5,900 filter options to help users identify promising investment opportunities.
Pricing Structure
Koyfin's pricing is designed to cater to a wide range of users, from casual investors to professional advisors:
| Plan | Monthly Cost | Key Features |
|---|---|---|
| Free | $0 | 2-year financials, advanced charting, 2 watchlists, 2 chart templates |
| Plus | $39 | 10-year data, unlimited watchlists, unlimited chart templates, filings |
| Premium | $79 | Everything in Plus, unlimited custom formulas, advanced portfolio analytics |
| Advisor Core | $209 | Model portfolios, client reports, custodian integration |
| Advisor Pro | $299 | Multiple integrations, 50 client reports monthly, priority support |
The free tier is ideal for individual investors who want to explore advanced charting with basic tools like two chart templates. For professional traders and advisors, the higher-tier plans unlock features such as unlimited custom formulas, model portfolio tools, and advanced analytics.
Koyfin has earned a 4.7/5 rating on Capterra, with users frequently highlighting its extensive data coverage and affordability. Additionally, the platform offers a 30-day satisfaction guarantee, giving users the chance to explore its full range of features without risk.
"Koyfin is an excellent research tool and with its global coverage of equities, analyst estimates and financials, it allows investors to carry out fast and comprehensive analysis." - Puru Saxena, Independent Investor
sbb-itb-2e26d5a
5. YCharts
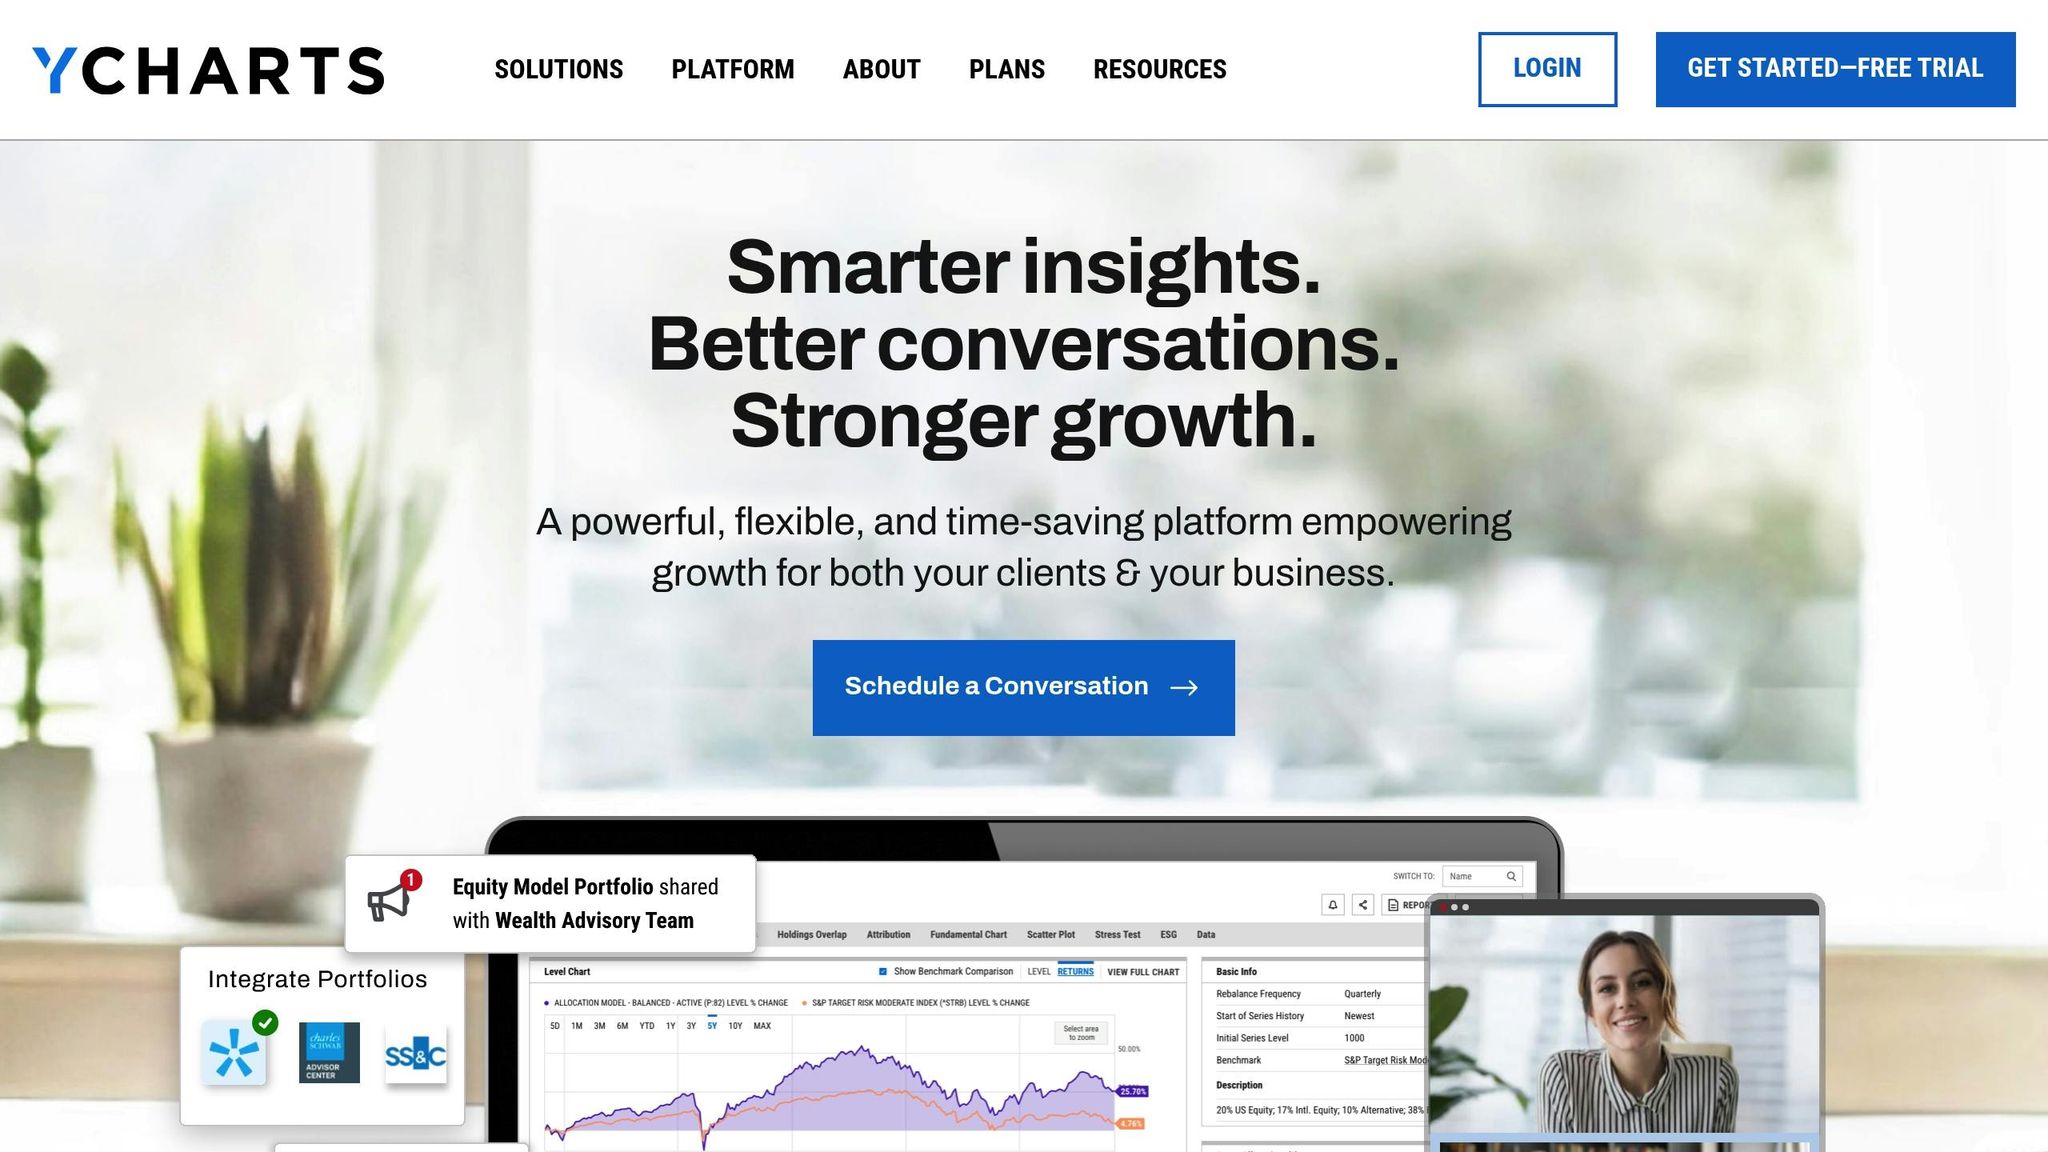
YCharts is a financial data platform designed for professionals, offering high-level technical analysis tools. One standout feature is its Technical Chart tool, which supports analysis for over 30,000 equities, ETFs, and indices.
The platform provides interactive charting in various formats like line, OHLC, and candlestick. Users can take advantage of features like cursor mode for real-time data inspection, a calendar selector for focused time-frame analysis, and the ability to toggle technical indicators with ease.
What sets YCharts apart is its extensive collection of over 30 overlays and oscillators. These include popular tools like SMA, EMA, MACD, RSI, and the Momentum Oscillator, allowing users to create custom views that can help pinpoint potential entry and exit points.
The platform’s visualization tools are highly flexible, enabling users to build and customize charts for comparing securities, spotting trends, and saving their work as PNG files for offline use.
Pricing Structure
YCharts operates on a subscription-based model with pricing tiers tailored to different professional needs. The three main plans - Standard, Professional, and Enterprise - are priced annually at $3,600, $6,000, and custom pricing, respectively:
| Plan | Annual Cost | Monthly Equivalent | Target Users |
|---|---|---|---|
| Standard | $3,600 | $300 | Individual professionals |
| Professional | $6,000 | $500 | Advanced users and small teams |
| Enterprise | Custom | Varies | Large organizations |
Each plan offers a different feature set. Higher-tier plans, like Enterprise, include advanced options such as firm-branded reports, custom colors and logos, custodian integrations, and compliance controls. In contrast, lower-tier plans focus on basic, view-only functionalities.
While YCharts is positioned as a high-end platform, its pricing reflects its target audience - financial professionals who need in-depth technical analysis tools. This makes it less accessible for casual retail investors but ideal for those requiring institutional-grade capabilities. Next, we’ll dive into a side-by-side comparison of these platforms in our Platform Comparison Table.
6. Morningstar Direct
Morningstar Direct is a high-end platform specifically designed to meet the needs of asset and wealth managers. Unlike platforms geared toward individual investors, this tool brings together key functions for portfolio managers, product developers, analysts, and researchers in one central interface, making it a go-to solution for institutional users.
The platform integrates proprietary data with proven methodologies, offering tailored analytical insights. With access to over 22 million securities and 150,000 investment strategies, it supports advanced technical analysis across global markets.
One standout feature, Direct Lens, allows users to quickly create, edit, and analyze portfolios, offering detailed insights into market exposure. It also excels in stress testing portfolios under different market scenarios and conducting detailed portfolio attribution analysis.
For those who rely on historical data, Morningstar Direct delivers a wealth of information. It provides historical portfolio holdings for US Open-End Mutual Funds dating back to 1997, along with monthly performance data starting from 1975. This extensive historical data is a powerful resource for uncovering long-term trends and patterns.
Advanced users will appreciate the platform's Analytics Lab and Python package, which enable sophisticated quantitative analyses. Meanwhile, the Presentation Studio simplifies the process of creating polished, client-ready reports and presentations. Users can customize data points, benchmarks, and Modern Portfolio Theory statistics to suit their specific needs.
"Whether it be from a retail or institutional perspective, Morningstar data is a standard language for our industry. Its consistent use across our business, amongst our peers, and in communications with our clients underscores Morningstar's impact on the industry", says Alex Lee, Head of ETF Strategy at Franklin Templeton Canada.
The platform’s features have earned praise from professionals in the field. For example, in Q1 2025, Research Analyst William S. utilized the platform to create hundreds of portfolios and performance reports, highlighting its comprehensive datasets and ability to generate insightful analyses. Similarly, Portfolio Manager Daanish K. relies on Morningstar Direct for investment meeting reports, appreciating how the platform presents data in an intuitive, easy-to-understand format.
Tailored Pricing for Institutions
Morningstar Direct offers a custom pricing model designed to meet the specific needs of institutional clients. Rather than providing standard pricing tiers, the company collaborates with organizations to create packages based on their requirements and the number of users. For qualified institutional users, a free trial is available, allowing potential clients to explore the platform’s capabilities before committing to a subscription.
The platform’s robust features and usability have earned it high praise. On Capterra, it holds an average rating of 4.1/5.
"Overall, this is a super powerful product with vast datasets", says Darren M., an Institutional Consulting Relationship Manager in Financial Services.
7. TipRanks
TipRanks is a platform that blends technical analysis with insights from over 96,000 financial experts, offering users a way to validate signals and assess market sentiment.
The Technical Analysis tab simplifies complex data by turning technical indicators into straightforward sentiment signals - Bearish, Neutral, or Bullish - and presenting them through easy-to-read graphical displays.
TipRanks covers technical analysis across nine different time frames, ranging from one minute to one month. It consolidates technical indicators into three summary signals: Moving Averages, Technical Indicators, and a combined score, making it easier for users to make informed decisions.
"TipRanks' technical indicators for brokers give your clients a streamlined and user-friendly way to access technical analysis information... Our technical analysis tool empowers your investors to make informed decisions and stay ahead of the curve in the stock market", states the TipRanks Team.
The platform's charts provide moving averages over six time periods, with clear Buy, Sell, or Neutral signals. These charts incorporate key indicators such as RSI, STOCH, MACD, CCI, and Williams %R, alongside Moving Averages and Pivot Points.
In February 2023, TipRanks showcased its Technical Analysis capabilities using Baidu (BIDU) stock. On a 1-month timeframe, the analysis revealed a "Strong Buy" signal from Moving Averages, a neutral signal from Oscillators, and an overall "Buy" signal from the TipRanks Summary Signal.
These features highlight TipRanks' seamless integration of technical and analyst-driven insights.
Analyst Integration and Smart Scoring
TipRanks combines its technical analysis tools with analyst consensus to offer a well-rounded view of investment opportunities. The Technical Analysis Screener integrates the Technical Analysis Score, Analyst Consensus, and TipRanks Smart Score, helping users align stock performance with professional insights. Investors can filter stocks based on analyst ratings, ranging from "Strong Buy" to "Strong Sell".
For those seeking more advanced tools, TipRanks offers an advanced charting tool featuring 120 studies and indicators, 13 chart types, and adjustable intervals. These charts also incorporate exclusive TipRanks data, such as analyst ratings, dividend information, and earnings reports.
Additionally, TipRanks actively tracks over 7,500 analysts, providing detailed insights into their success rates and reliability.
"With these three signals, TipRanks users can quickly and easily assess a stock's technical health and make informed investment decisions, without having to analyze individual indicators and perform complex calculations themselves", explains the TipRanks Team.
With its combination of technical analysis tools and expert ratings, TipRanks caters to a range of investor needs through flexible pricing options.
Flexible Pricing Structure
TipRanks offers three subscription plans to suit different types of investors:
- The Basic plan is free and provides limited access to stock analysis tools, email alerts for up to 5 stocks, and no customer support.
- The Premium plan costs $29.95 per month (billed annually) and includes advanced stock analysis, investment ideas, email alerts for up to 30 stocks, priority customer support, and PDF data export.
- The Ultimate plan, priced at $49.95 per month (billed annually), unlocks all features, including unlimited email alerts, top-priority support, PDF and CSV data export, customizable expert ranking parameters, and specialized tools like "Hot Insider Stocks".
TipRanks has earned a Trustpilot score of 4.4 with an Excellent rating and a 4.8/5 for its expert analysis tracking and stock ratings. Users value its analyst accountability, detailed research tools, and data-driven approach, though some find the amount of information overwhelming for beginners.
Platform Comparison Table
Selecting the right equity research platform hinges on your trading experience, budget, and specific technical analysis requirements. Below is a detailed comparison of seven popular platforms to help you decide.
| Platform | Monthly Pricing (USD) | Best For | Key Technical Analysis Features | Main Strengths | Limitations |
|---|---|---|---|---|---|
| TradingView | $12.95 - $49.95 | All trader levels globally | 100+ indicators, advanced charting, pattern recognition, Pine Script | Global community of 100+ million users, excellent charting tools, social trading features | Many advanced features require a paid subscription |
| Stock Rover | $7.99 - $27.99 | Long-term investors | Screening tools, fundamental charting, portfolio analysis | Comprehensive financial data screening, research-focused approach | Limited technical indicators compared to trading-focused platforms |
| Quodd | $1,000 - $1,500 | Professional traders | Real-time data feeds, customizable charts, API access | Ultra-low latency data, institutional-grade reliability | High cost, complex setup for individual traders |
| Koyfin | Free - $79 | Financial professionals | Economic data integration, sector analysis, macro indicators | Strong fundamental and macro analysis, free version available | Limited pure technical analysis tools |
| YCharts | $300 - $500 | Investment advisors | Client presentation tools, comparative analysis, custom charts | Professional presentation capabilities, advisor-focused features | Expensive for individual traders, limited automation |
| Morningstar Direct | $833+ | Institutional investors | Risk analysis, portfolio modeling, research integration | Comprehensive research database, institutional credibility | Very expensive and often overkill for individual traders |
| TipRanks | Free - $49.95 | All investor types | Technical sentiment signals, analyst integration, smart scoring | Combines technical and fundamental analysis, expert tracking | Can be overwhelming for beginners due to extensive data |
This comparison highlights the key features, strengths, and drawbacks of each platform. Pricing varies significantly, with some options tailored for individual traders starting as low as $12.95 per month, while institutional-grade platforms can cost upwards of $1,000.
TradingView stands out for its versatility, catering to traders of all skill levels through an intuitive interface and a large, active community. Beginners can explore free versions of platforms like TradingView, Koyfin, and TipRanks to get started without financial commitment.
For professional traders, the speed and quality of data are crucial. Platforms like Quodd deliver ultra-low latency feeds, ideal for high-frequency trading, while Stock Rover focuses on comprehensive fundamental data for long-term strategies. The ability to provide fast, accurate technical analysis remains a critical factor across all platforms.
When it comes to cost-effectiveness, individual traders often find value in TradingView's mid-tier plans, while investment advisors may see the higher costs of YCharts as justified by its advanced client presentation tools. Ultimately, the right choice depends on whether a platform's features align with your specific technical analysis needs and workflow.
This overview simplifies the decision-making process, helping you pinpoint the platform that complements your trading strategy.
Conclusion
Selecting the best equity research platform for technical analysis comes down to your experience level, specific feature requirements, and budget. The platforms reviewed here each bring unique strengths to the table, catering to different types of investors.
If you're just starting out, look for platforms that offer educational resources and easy-to-use interfaces. TradingView, for instance, stands out with its free tier and active community features, making it a solid choice for beginners. For active traders who need advanced tools and real-time data, TradingView's premium plans and Quodd's institutional-grade feeds provide the depth and speed required. Meanwhile, long-term investors might prefer platforms like Stock Rover, which combines technical analysis with robust fundamental screening and portfolio tracking tools.
Budget is another key factor. Take advantage of free tiers offered by platforms like TradingView, Koyfin, and TipRanks to test their features before deciding on a subscription. Regardless of your choice, a user-friendly interface and access to comprehensive market data are critical for success.
For more tools and resources to enhance your investment research, check out the Best Investing Tools Directory. It’s packed with options, from investment newsletters to charting software and technical analysis tools. Ultimately, your decision should reflect your trading style and long-term financial objectives.
FAQs
What should I look for in an equity research platform for technical analysis?
When choosing an equity research platform for technical analysis, prioritize features like real-time data, customizable charts, and a variety of technical indicators. These tools are crucial for spotting trends and making informed investment choices based on data.
You’ll also want to evaluate the platform’s user-friendliness, dependability, and availability of advanced tools such as backtesting or automated alerts. These can streamline your analysis process and save valuable time, particularly if you’re an active trader or investor.
How does the pricing of equity research platforms affect their accessibility for individual and institutional investors?
The cost structures of equity research platforms often differ depending on the intended users. Institutional investors usually have access to tiered or personalized pricing plans, often featuring volume discounts and customized options to suit their larger budgets. On the other hand, individual investors might encounter steeper per-user fees or restricted access to advanced tools, which can make these platforms less budget-friendly for personal use.
This pricing gap means institutions often gain easier access to sophisticated research tools, while individuals may need to look for lower-cost alternatives or stick with basic versions of these platforms.
Are there any free platforms with reliable technical analysis tools for beginners?
Some platforms offer free, reliable technical analysis tools that are great for beginners. TradingView, for example, has a free version packed with interactive charts and a variety of indicators, making it a solid option for those new to trading. Likewise, NinjaTrader gives users free access to advanced charting tools and market analysis features, allowing you to learn and practice technical analysis without spending a dime.
