Fund flow tools help investors track money movements in mutual funds and ETFs, providing insights into market trends and investor sentiment. This guide compares seven popular tools based on features like data frequency, asset coverage, visualization, and pricing. Here's a quick summary:
- ETF.com Fund Flows Tool: Focused on ETFs with daily updates and basic visuals. Free for basic access.
- Bloomberg Terminal: Real-time data for all asset classes, advanced charting, and institutional-grade features. Costs ~$32,000/year.
- Morningstar Direct: Monthly updates with deep historical data and professional-grade visuals. Enterprise pricing.
- EPFR Global: Daily and weekly updates with global fund coverage and robust API integration. Custom institutional pricing.
- FactSet Fund Flows: Real-time updates, extensive global data, and seamless integration with analytics tools. Enterprise pricing.
- Lipper Fund Flows (Refinitiv): Daily, weekly, and monthly updates with broad global coverage and professional visuals. Subscription-based pricing.
- ICI Fund Flow Data: Weekly updates for U.S. mutual funds with interactive visualization. Free public access.
Tracking Bitcoin ETF Fund Flows
Quick Comparison
| Tool | Data Frequency | Asset Types Covered | Visualization Features | Best For | Pricing |
|---|---|---|---|---|---|
| ETF.com | Daily, weekly, monthly | ETFs (all sectors) | Basic visuals | Individual investors | Free |
| Bloomberg Terminal | Real-time, daily | All asset classes globally | Advanced charting | Institutional investors | ~$32,000/year |
| Morningstar Direct | Monthly, some daily | Mutual funds, ETFs, alternatives | Professional-grade visuals | Asset managers, analysts | Custom pricing |
| EPFR Global | Daily, weekly | Global funds (all regions) | Advanced analytics dashboard | Institutional investors | Custom pricing |
| FactSet | Real-time, daily | Mutual funds, ETFs (global) | Integrated analytics | Large institutions | Custom pricing |
| Lipper Fund Flows | Daily, weekly, monthly | Mutual funds, ETFs (global) | Professional visuals | Asset managers, advisors | Subscription |
| ICI | Weekly | U.S. mutual funds | Interactive visualization | Market researchers, analysts | Free |
Choose a tool based on your needs: Free options like ICI and ETF.com are great for basic tracking, while premium platforms like Bloomberg Terminal and FactSet offer advanced features for institutional users.
How to Choose Fund Flow Tools
Picking the right fund flow tool involves balancing your specific needs, budget, and how well the tool fits into your workflow. These considerations will help you evaluate the tools discussed below.
Data Coverage and Scope is the backbone of any fund flow tool. Look for platforms that provide extensive coverage across mutual funds, ETFs, and a variety of asset classes like equities, fixed-income, and alternative investments. The broader the coverage, the clearer your view of market sentiment will be - narrow data could leave you with an incomplete picture.
Daily Update Frequency matters when tracking fund flows in real time. Markets shift quickly, and yesterday’s data might not reflect key changes in investor behavior. Tools with daily updates allow you to spot trends as they emerge, giving you a chance to act before the market catches on.
Historical Data Depth is crucial for understanding current trends in context. For example, EPFR offers over 25 years of fund flow and allocation data, enabling users to identify long-term patterns and differentiate between short-term noise and meaningful shifts in investor sentiment. This historical perspective is invaluable for making informed decisions.
Visualization and Charting Capabilities transform raw data into actionable insights. Tools with advanced filtering, customizable charts, heat maps, and comparative analysis features help you uncover patterns and anomalies. These capabilities are especially useful for identifying medium- and long-term market trends.
Platform Integration plays a big role in streamlining your workflow. The tool you choose should integrate easily with your portfolio management, trading, or research systems. This reduces manual work and minimizes errors, making your processes more efficient.
Cost Structure can vary widely. Some tools are free, while others - especially those designed for institutional use - can cost thousands of dollars per month. Beyond subscription fees, consider additional costs for API access, extra data feeds, or premium features. A detailed cost-benefit analysis will help ensure the tool’s value matches its price, particularly for enterprise-level solutions.
User Base and Market Adoption can reveal a tool’s reliability and reputation. Tools trusted by institutional investors often offer more robust data and better support. One EPFR client shared this insight:
"If you are a macro-strategy team, EPFR is a must. I don't think there is a better flow and allocation data provider in the market."
– Financial Services Provider, EPFR client since 2015
API Access and Customization are essential for advanced users. APIs allow you to programmatically access data for custom analysis and automated reporting. Keep in mind that API costs can add up, so include them in your overall cost analysis.
Ultimately, the right tool depends on your specific needs. Individual investors might prioritize ease of use and affordability, while institutional users often require comprehensive data, robust APIs, and enterprise-grade support. By analyzing fund inflows and outflows, you can gauge market sentiment, anticipate price movements, and align your strategies with emerging trends - or even identify contrarian opportunities. Use these criteria to guide your decision as you explore the tools in the next sections.
1. ETF.com Fund Flows Tool
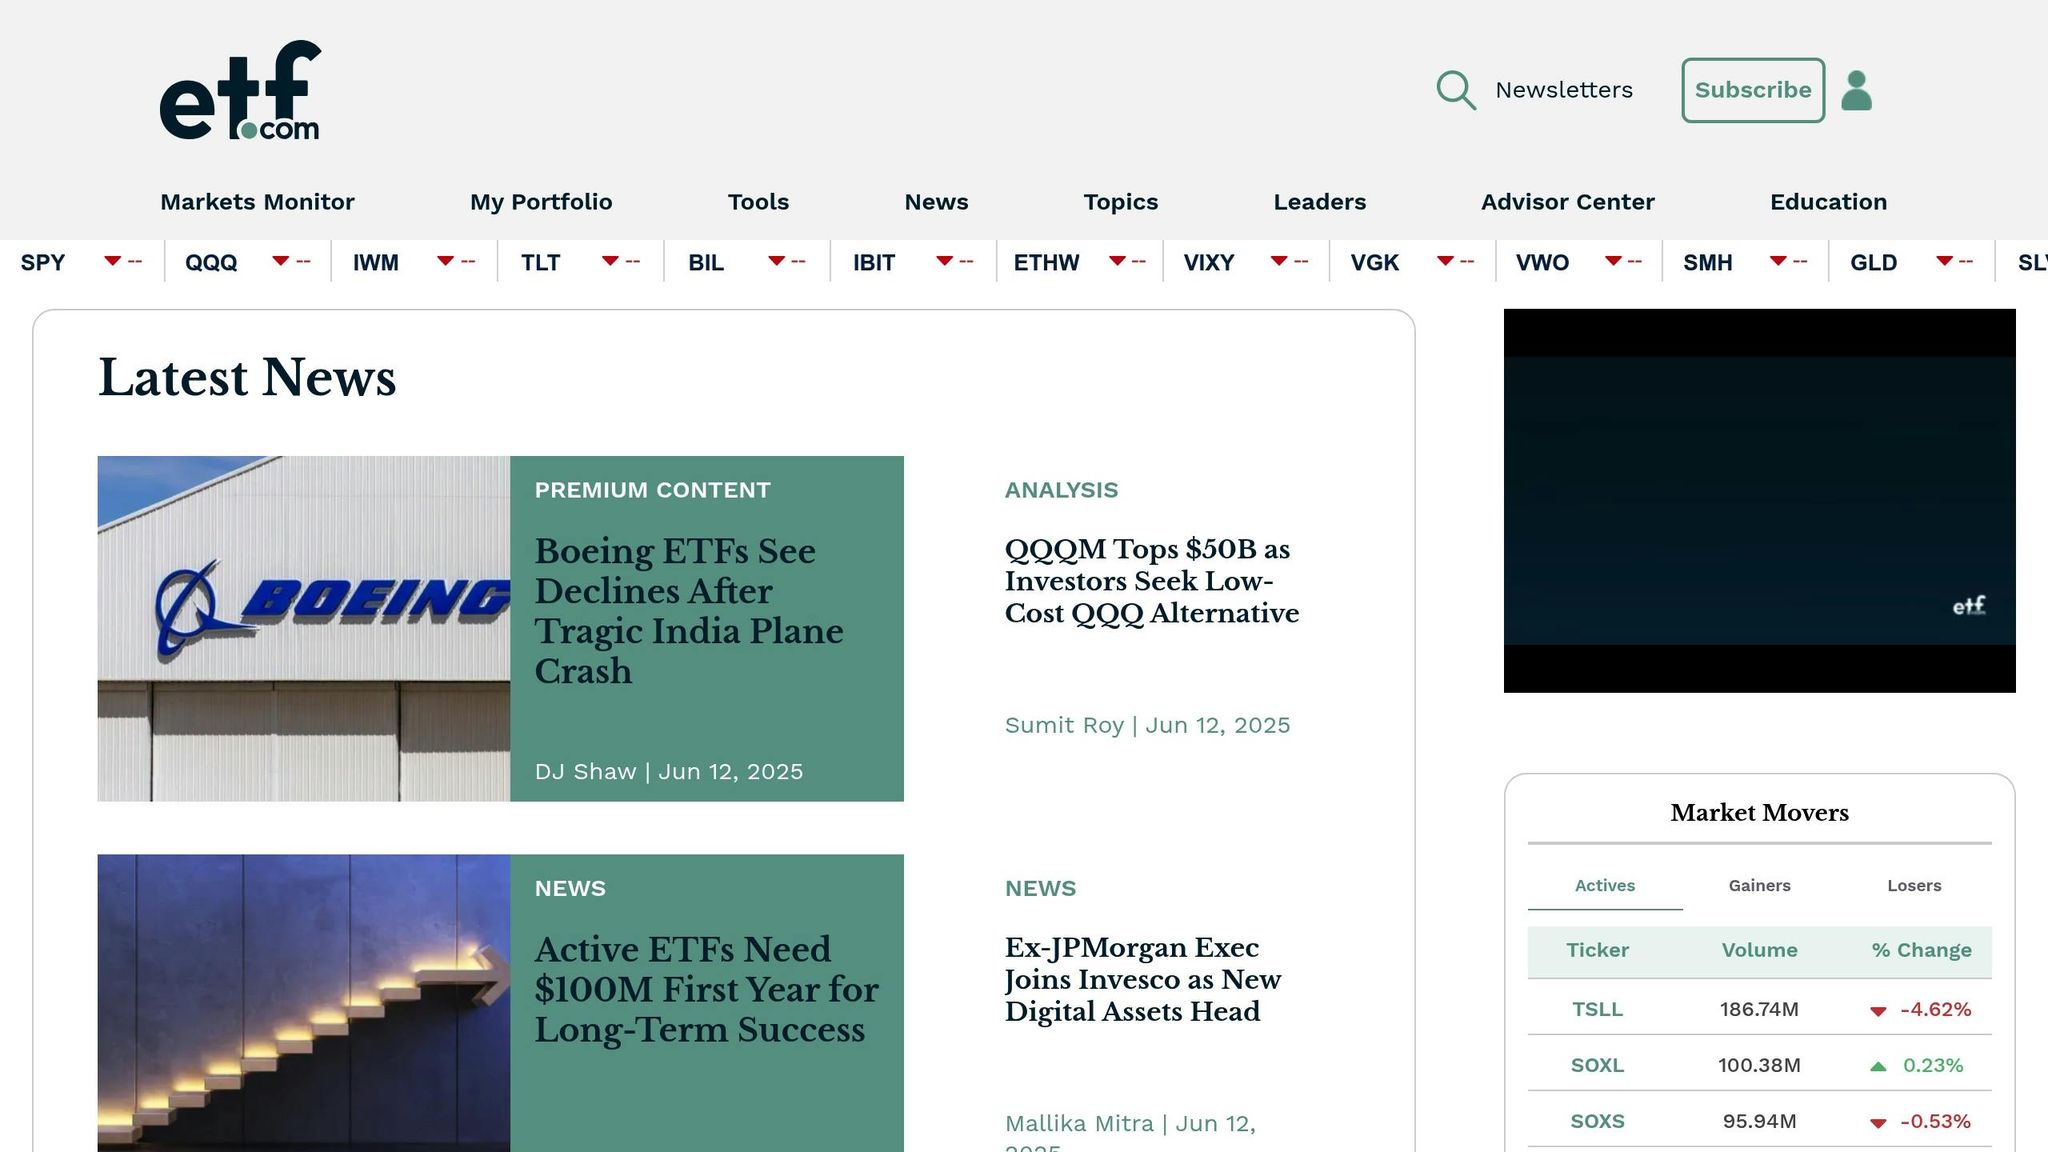
ETF.com's Fund Flows Tool is a go-to resource for tracking ETF investor behavior and market trends. Covering over 4,300 exchange-traded funds, it caters to both retail investors and financial professionals, offering a broad view of the ETF landscape.
This tool zeroes in on ETF fund flows, providing insights into equity, fixed income, and commodity ETFs. By focusing on these areas, ETF.com delivers a clear picture of how investors are allocating their assets and adjusting their strategies. Here’s what makes this tool stand out for monitoring fund flows.
Data Frequency
The platform provides fund flow data on daily, weekly, and monthly intervals, making it flexible for different analytical needs. While daily updates are available, there’s a one-day delay in data availability due to the time required for processing - this is standard across most fund flow tools.
Asset Class Coverage
ETF.com ensures thorough coverage across all major ETF categories, staying true to its specialized focus.
Visualization and Reporting Features
ETF.com pairs its fund flow data with ETF Pulse, a built-in analytics tool that transforms raw numbers into easy-to-understand visuals. By combining fund flows with performance metrics, it offers users a clear view of market sentiment. Simply input an ETF ticker, select a date range, and the tool generates a detailed breakdown of fund flows and net figures. This streamlined process makes it easier to interpret trends and make informed decisions.
2. Bloomberg Terminal Fund Flows
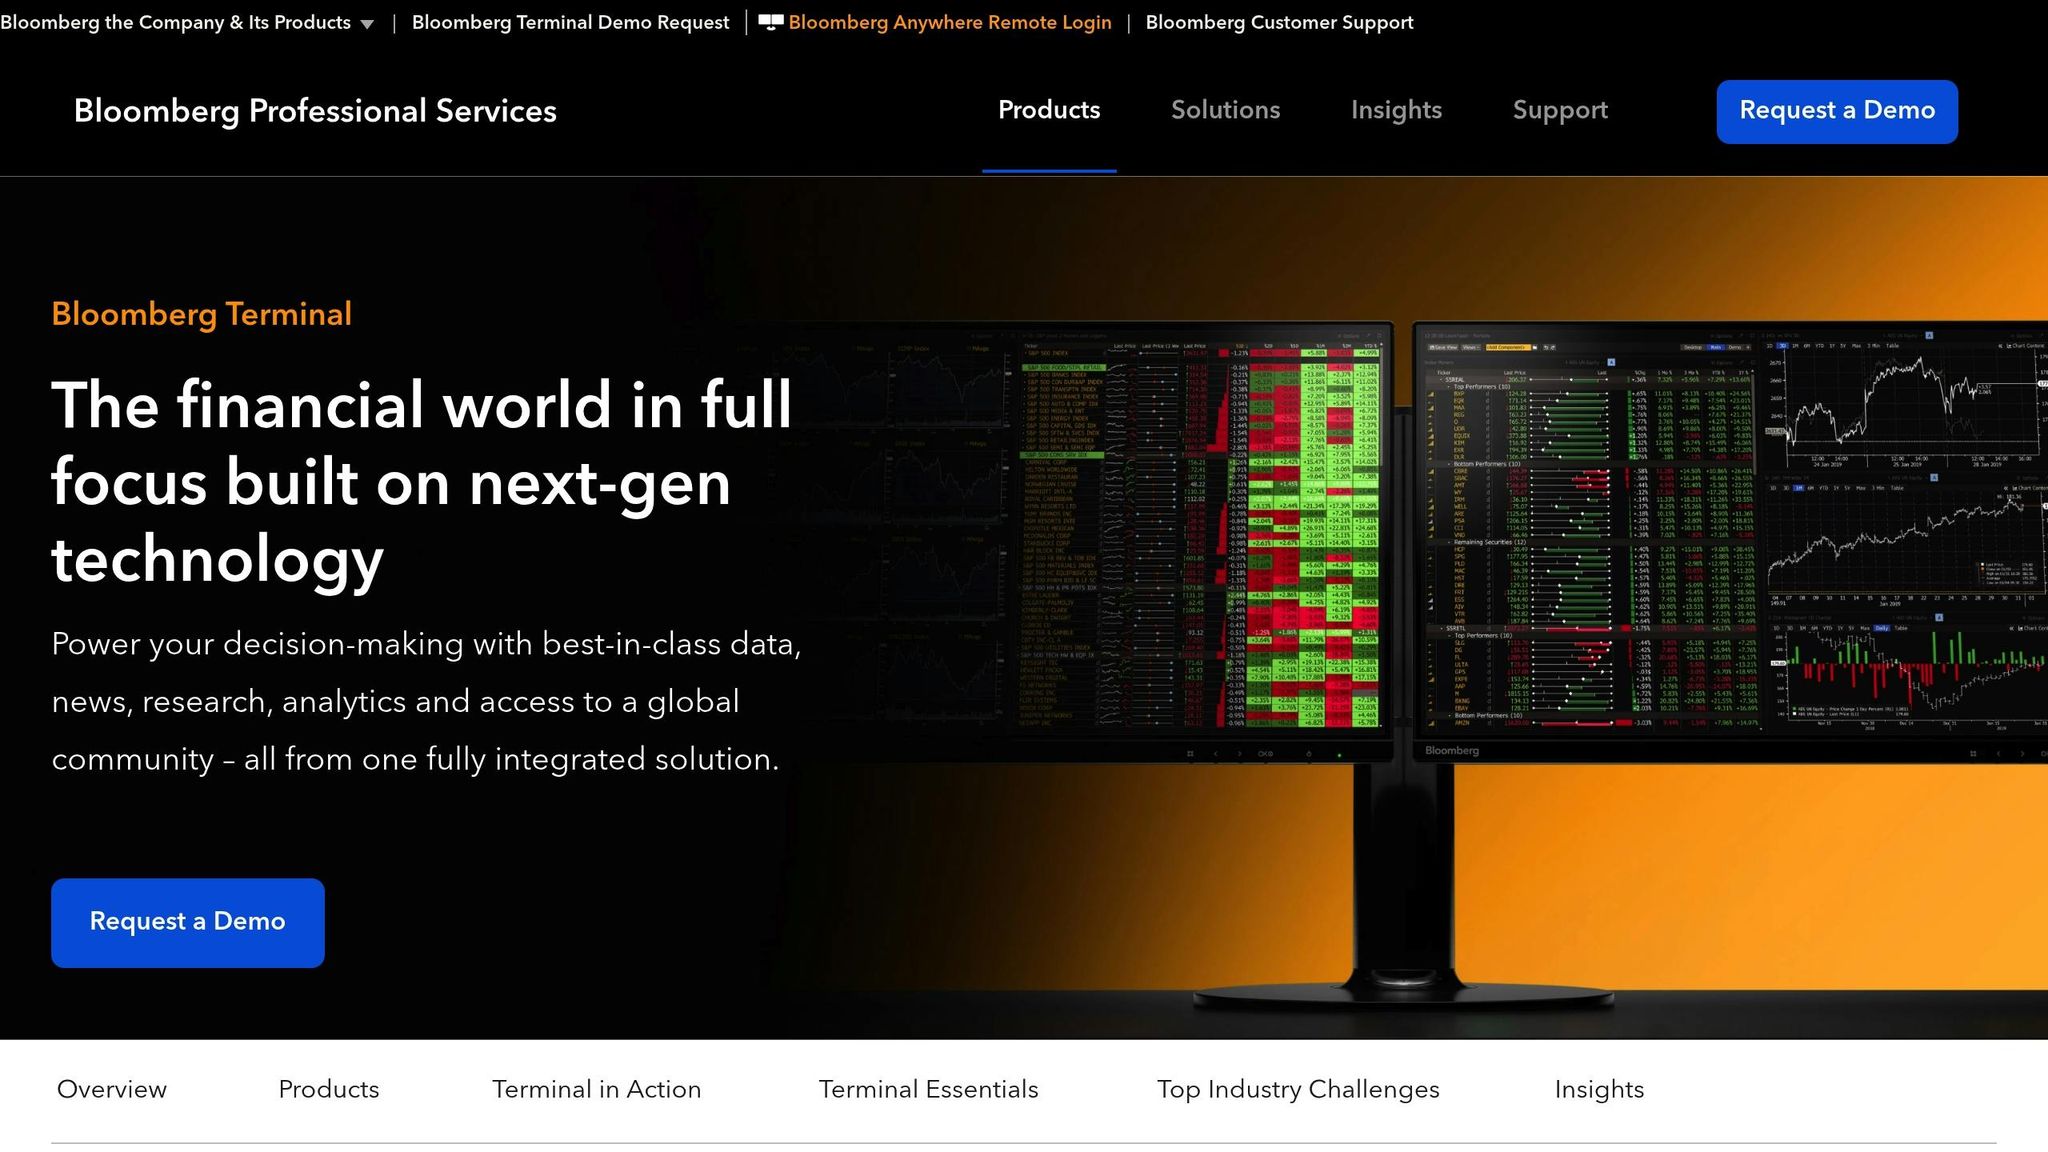
The Bloomberg Terminal is a go-to tool for institutional investors tracking daily fund flows. With a global user base of over 325,000 business and investment professionals, it offers a wealth of data on fund flows across various investment instruments.
This platform covers a wide range of assets, including equities, fixed income, currencies, commodities, mutual funds, and ETFs. Its extensive reach makes it a powerful resource for analyzing capital movements across different portfolios and market segments.
Data Frequency
Bloomberg's fund flow metrics are designed to provide timely insights, meeting the high standards of institutional users. While some analytics are updated daily, there is often a brief processing delay. These metrics are based on years of consumer transaction data, ensuring a solid foundation for analysis.
Asset Class Coverage
To streamline navigation, Bloomberg organizes its terminal functions by major asset classes - such as government bonds, corporate debt, municipal securities, commodities, equities, and currencies - allowing users to access relevant data quickly and efficiently.
Visualization and Reporting Features
The terminal includes advanced charting tools that can be customized with templates, export options, and interactive mapping features. Its high-contrast interface ensures that critical data is easy to view and interpret. These tools enable institutional investors to gain real-time insights and make informed decisions promptly.
Pricing (USD)
The Bloomberg Terminal comes with a hefty price tag of approximately $32,000 per year. While it’s a premium investment, the platform’s comprehensive fund flow data and real-time analytics offer immense value for organizations that rely on precise and timely market intelligence.
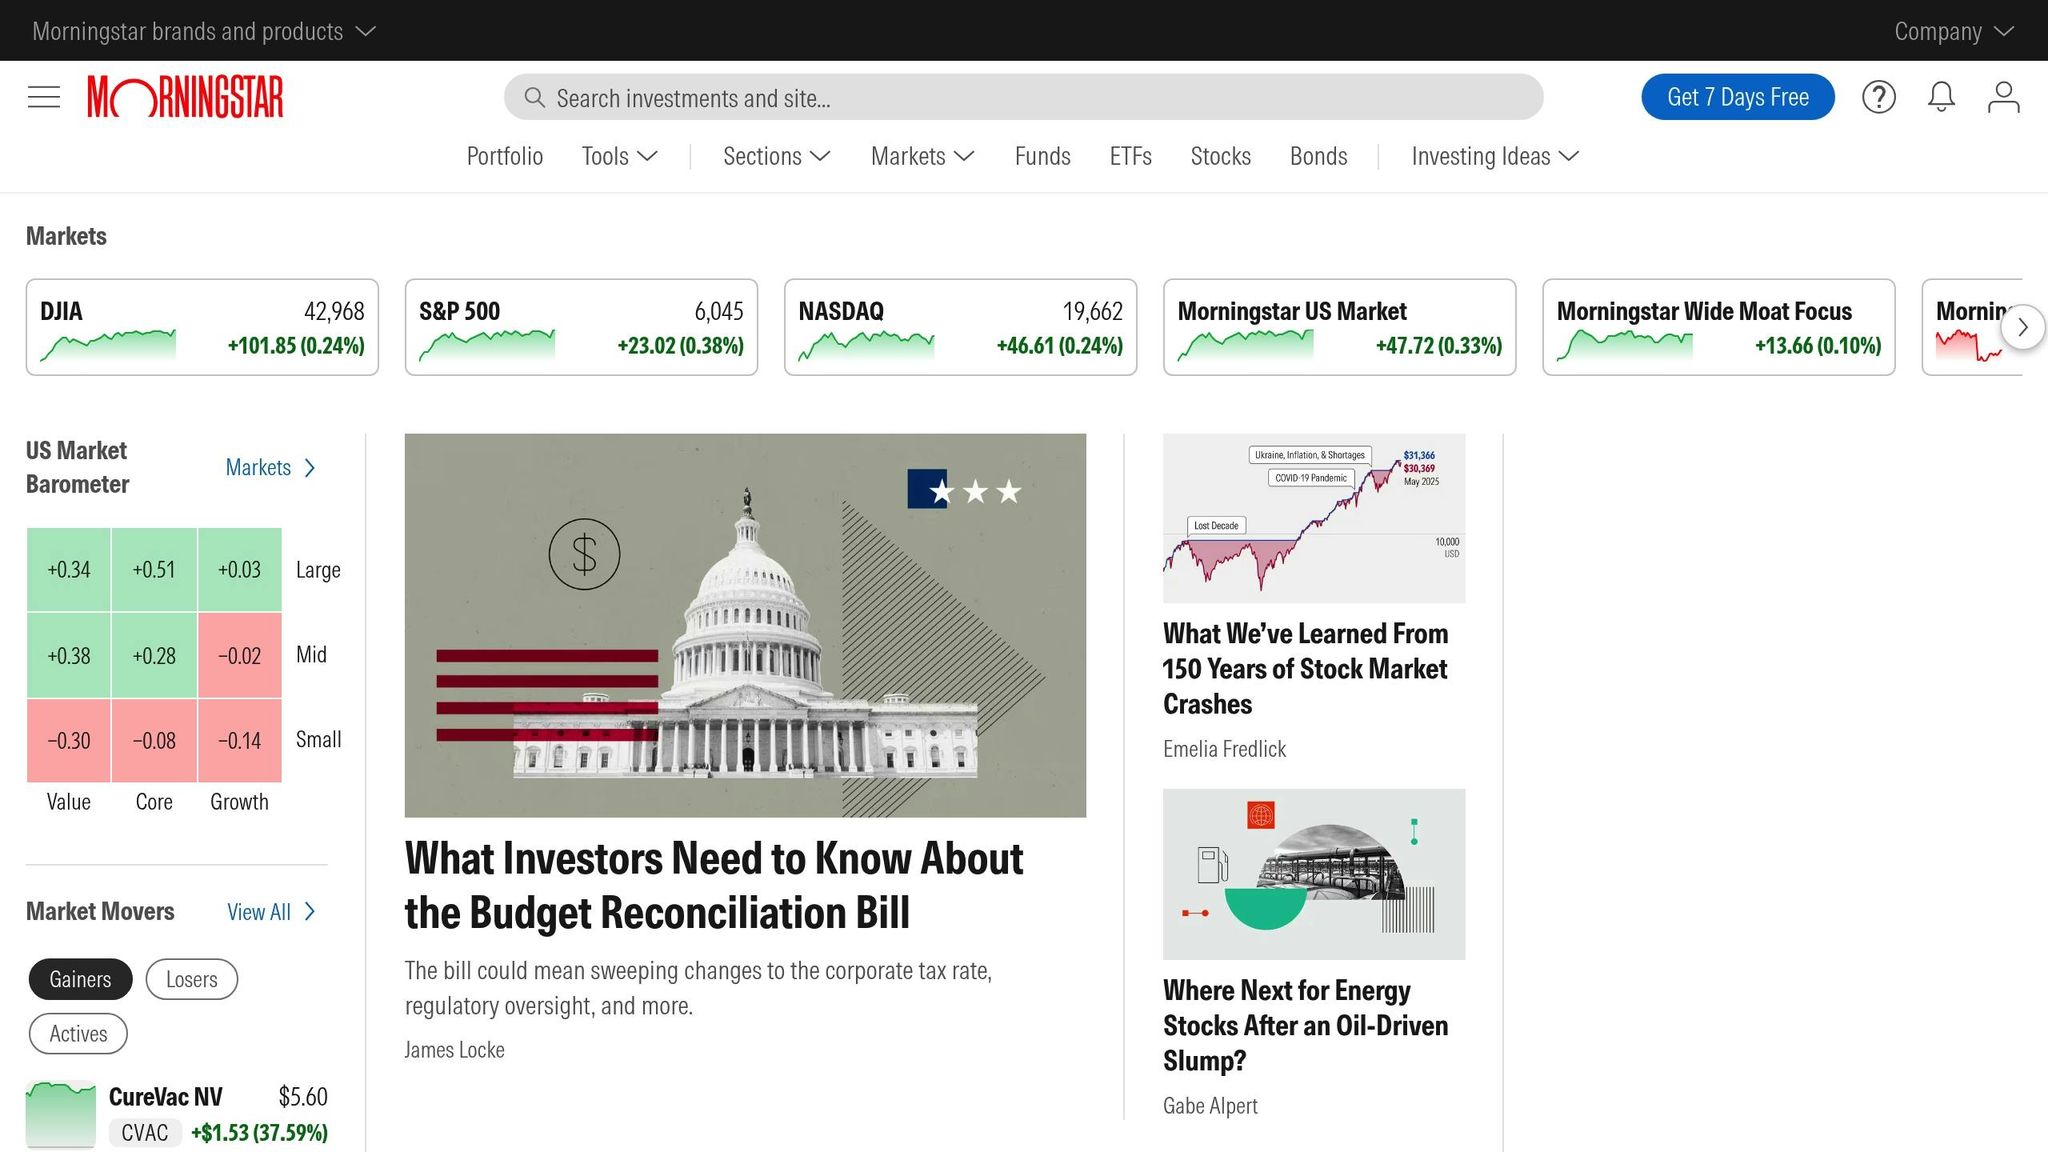
3. Morningstar Direct
Morningstar Direct is a research platform that provides insights into over 600,000 collective investments. Its database includes historical fund flows data dating back to 2008, enabling users to analyze trends over time. Designed for portfolio managers, analysts, and researchers, the platform offers detailed insights into capital movements across various investment vehicles. It also includes forecasting models to estimate future growth rates.
Data Frequency
Morningstar Direct updates its fund flows data monthly, unlike tools that offer daily updates. While this might not suit traders or analysts who require real-time data, the monthly updates are ideal for institutional investors focused on long-term strategies and trend analysis. The platform’s historical data and predictive models provide a broad view of market movements over time.
Asset Class Coverage
The platform tracks fund flows across bonds, stocks, and alternative assets, offering a comprehensive understanding of investor sentiment toward different asset classes. Reports can be segmented by asset class, domicile, and Morningstar category, allowing users to analyze data from multiple angles.
Morningstar Direct covers fund flows in key global regions, including Europe, the United Kingdom, the United States, and Japan. This international reach makes it especially useful for asset managers handling global portfolios or those interested in cross-border investment patterns.
For example, data indicates that fixed-income open-end funds and ETFs saw over $1 trillion in global flows by December 2024, while equity's share of long-term assets in mutual funds and ETFs rose to 63% in 2024. Such insights provide a detailed view of market activity, supporting effective reporting and decision-making.
Visualization and Reporting Features
Morningstar Direct excels at turning complex data into actionable insights. Asset managers can use the platform to connect their investment strategies to broader market trends, benchmark products against competitors, and create reports that meet compliance standards.
The platform’s Presentation Studio is a standout feature, enabling users to craft custom reports, product comparisons, and presentations that simplify intricate investment information. Additionally, the Report Portal offers pre-designed, strategy-focused templates that can be tailored to specific needs.
These tools make it easy to produce professional-grade materials for client presentations or internal discussions. Whether it's showcasing fund performance or analyzing flow trends, the platform’s visualization and reporting capabilities are a major asset for asset managers.
Pricing
Morningstar Direct operates on a subscription basis, with costs determined by the number of users and the level of data access required. Its pricing structure is typically well-suited for large asset management firms that can leverage its extensive features.
4. EPFR Global
EPFR Global has been a trusted source of fund flow data for over 25 years, offering insights from more than 151,000 share classes and tracking an impressive $55 trillion in assets under management (AUM). The platform caters to diverse analytical needs with its core and hybrid datasets. Core datasets are sourced directly from fund managers and administrators, while hybrid datasets combine fund flows and allocation data, offering a richer view of money movements across regions, sectors, industries, and even individual stocks.
Data Frequency
EPFR Global provides fund flow data on a daily, weekly, and monthly basis, making it versatile for various investment strategies and timeframes. Its Early Edge Fund Flows feature delivers some of the most timely aggregate fund flow reports available, often at or before market open on a T+1 basis.
The platform gathers data from thousands of sources worldwide, adhering to a 24-hour production cycle for near real-time updates. Weekly and daily datasets cover over 15,000 equity funds and 7,000 debt funds, representing about 65% of the AUM included in the monthly data.
Asset Class Coverage
EPFR Global tracks fund flows across a wide range of asset classes, including:
- Equity fund flows
- Bond fund flows
- Money market flows
- Alternative fund flows
- Multi-asset flows
The platform monitors more than $7 trillion in money market funds worldwide, offering a detailed view of this critical segment. Additionally, it provides specialized datasets for country flows, sector flows, and industry flows, enabling users to dive deep into specific trends, whether at a regional, sectoral, or industry level.
For example, in June 2025, EPFR-tracked Emerging Markets Equity and Bond Funds saw renewed investor interest due to shifts in U.S. monetary policy and a weakening dollar. On the flip side, EPFR-tracked Japan Equity Funds faced record redemptions in late May 2025 after a disappointing Japanese government bond auction. These examples highlight how EPFR's granular data can reveal critical shifts in investor sentiment.
Integration with Other Platforms
EPFR Global's data integrates seamlessly with existing systems, thanks to its enhanced REST API. The API supports multiple programming languages, including Python, R, JavaScript, and PHP, offering flexibility for users to embed EPFR data into their analytical workflows.
"APIs are essential for investment professionals seeking to integrate data directly into their models and workflows. With real-time access to EPFR's comprehensive fund flow and allocation data, clients can improve efficiency, reduce latency, and make faster, data-driven decisions in an increasingly dynamic market environment."
- Steven Pulley, CEO of ISI Markets
The API provides access to fund, country, and industry flow and allocation data, covering over $60 trillion in assets across 151,000+ fund share classes. It employs secure, industry-standard protocols to ensure safe data delivery.
In June 2024, CEIC partnered with EPFR to combine fund flow and asset allocation data with CEIC's macroeconomic analytics. This collaboration allows CEIC users to access EPFR data alongside 3,500 other data sources, leveraging customizable charting tools and enterprise-ready APIs with Python and R integration. EPFR also partners with Crux Informatics to enhance data management capabilities.
Pricing
EPFR Global operates on a subscription-based pricing model tailored to the specific data access and integration needs of users. Its extensive coverage of over $55 trillion in tracked assets, combined with robust API capabilities, positions it as a premium solution for institutional investors and asset managers seeking in-depth fund flow analytics. Pricing varies based on the scope of access and user requirements, reflecting the platform's enterprise-level focus.
sbb-itb-2e26d5a
5. FactSet Fund Flows
FactSet Fund Flows offers a comprehensive tracking system for mutual funds and ETFs across the United States and Europe. This makes it a go-to resource for institutional investors monitoring fund activity in these major markets.
Data Frequency
FactSet provides daily updates with intraday capabilities for ETF data, ensuring users stay informed throughout the trading day. When it comes to mutual funds, the platform includes historical fund flows data through its Time Series feature, offering detailed fund and share class–specific insights for key listings. Additionally, FactSet sources ETF data from providers worldwide, capturing over 100 unique data points per fund.
This timely and detailed data underpins accurate tracking of asset classes.
Asset Class Coverage
FactSet tracks both mutual funds and ETFs extensively. For the U.S. market, it monitors 5,500 mutual funds across 13,000 share classes, each with a minimum two-year history. In Europe, coverage expands to 9,200 funds across 23,000 share classes, with at least one year of historical data.
ETF coverage is equally robust. In the U.S., the platform includes 4,690 ETF Holdings Detail records (dating back to 2016), 5,410 ETF Time Series records (since 1993), and 7,217 ETF Reference data points as of December 2024. For the EMEA region, it tracks 3,722 ETF Holdings Detail records (since 2018) and 4,449 ETF Time Series records (since 2003). During the first half of 2024, currency ETFs accounted for 3.6% of all flows, with $14.7 billion directed into spot Bitcoin ETFs.
Visualization and Reporting Features
FactSet equips users with powerful visualization tools that seamlessly integrate financial data into their workflows. For example, users can create fully balanced financial statement visualizations by utilizing data from FactSet's dynamic financial statement API.
The platform’s reporting suite combines data, design, and distribution into a single solution. Users can customize reports to meet specific design needs, schedule them flexibly, and distribute them efficiently. FactSet also enables large-scale portfolio analytics reporting using intuitive, modern tools. With seamless integration into Microsoft Office applications, users can build custom financial models, tables, presentations, and charts. These tools also support portfolio analytics with adaptable reports and charts to meet diverse analytical requirements.
Integration with Other Platforms
FactSet’s integration features enhance its utility by offering comprehensive API access and compatibility with third-party platforms. This allows institutional investors to incorporate fund flow data into their existing analytical systems and workflows. Its global data sourcing approach ensures it aligns with international investment strategies, while its extensive historical data supports both daily monitoring and long-term trend analysis.
These integration capabilities enhance the platform's overall functionality for institutional users.
Pricing
FactSet Fund Flows is available through an enterprise-level subscription model tailored to institutional clients. With its extensive coverage - including 5,500 U.S. mutual funds, 9,200 European funds, and detailed ETF tracking - FactSet positions itself as a premium option for asset managers and institutional investors. Pricing depends on factors like data scope, regional coverage, and integration needs, reflecting its focus on serving large-scale institutions.
6. Lipper Fund Flows (Refinitiv)
Lipper Fund Flows stands out as a trusted name in daily fund flow tracking, boasting over 45 years of experience in delivering independent fund analysis and content. This deep-rooted expertise ensures reliable, up-to-date data that helps users stay informed.
Data Frequency
Lipper Global Fund Flows offers estimated net flows on a daily, weekly, and monthly basis across global markets. This flexibility allows users to filter data for both short-term decisions and more in-depth, long-term analysis. The platform's frequent updates ensure access to the latest individual and aggregate historical fund flow data.
Asset Class Coverage
The platform's database is impressively broad, encompassing over 385,000 active share classes in 80+ markets and data on more than 330,000 collective investments across 113 countries. It includes a wide range of asset types such as mutual funds, closed-end funds, ETFs, hedge funds, domestic retirement funds, pension funds, and insurance products. Lipper uses a proprietary classification system with over 500 categories, enabling users to create peer groups tailored to market dynamics for effective fund selection, comparison, and benchmarking.
Visualization and Reporting Features
Lipper offers powerful visualization tools that transform complex data into easy-to-understand charts and maps, giving users a clear view of global fund movements. These tools allow users to explore estimated net fund flows by geography, fund domicile, or classification using Lipper’s proprietary system. The platform also provides access to both individual and historical aggregate flows. Additionally, LSEG Lipper for Investment Management integrates analytics, reporting tools, and proprietary Fund Market Research to help users monitor fund performance and conduct detailed comparative analyses.
Integration with Other Platforms
Lipper's capabilities extend beyond data analysis. The platform integrates seamlessly into institutional workflows, supporting tasks like benchmarking, risk management, due diligence, and product strategy. Its representative calculation methodology ensures consistent tracking of fund flow activity across various analytical tools, making it a versatile resource for professionals in the investment space.
7. ICI (Investment Company Institute) Fund Flow Data
The Investment Company Institute (ICI) plays a key role as the national trade association for the U.S. investment company industry. It provides fund flow data for nearly all U.S. mutual funds. Although ICI doesn’t update its data daily, its weekly reports offer valuable insights into long-term trends in the American investment landscape. These weekly updates serve as a complement to daily tracking tools, providing a broader perspective on fund movement patterns.
Data Frequency
ICI releases estimated long-term mutual fund flow data every week, with figures reflecting activity as of Wednesday. Additionally, it publishes monthly data in its "Trends in Mutual Fund Investing" report, which covers an impressive 98% of industry assets.
Asset Class Coverage
ICI's fund flow data spans equity, bond, and hybrid funds within the U.S. mutual fund market. For the week ending June 4, 2025, ICI reported total estimated outflows of $12.94 billion. Equity funds experienced significant outflows of $21.22 billion, broken down into $16.89 billion from domestic equity and $4.33 billion from world equity. On the other hand, bond funds saw inflows totaling $9.65 billion, divided into $9.49 billion for taxable bonds and $163 million for municipal bonds. ICI's data also provides detailed breakdowns, such as market capitalization for domestic equity, regional segmentation for world equity, and subcategories like investment grade, high yield, government, multisector, and global bonds for taxable bonds.
Visualization and Reporting Features
ICI has introduced a dynamic data visualization tool in its Fact Book, transforming static reports into interactive charts. This tool prioritizes clarity and usability, making it easier to analyze the data.
"For this edition of Fact Book, we also are excited to introduce our new data visualization tool. This innovative charting feature offers interactive, insightful displays of ICI's comprehensive data. Each of the data tables can now be viewed in graphical form, making it easier to analyze and interpret the information in Fact Book", - ICI Chief Economist Shelly Antoniewicz
The visualization platform includes features like drop-down menus for selecting specific data series and time frames, allowing users to customize their analysis. Charts can be downloaded as images, and the underlying data is exportable as Excel files for deeper exploration. Key highlights from 2024 include worldwide regulated open-end long-term funds net sales of $2.3 trillion, a record ETF net issuance of $1.1 trillion, and the fact that 56% of U.S. households owned shares of mutual funds or other U.S.-registered investment companies.
Fund Flow Tools Comparison Chart
Selecting the right fund flow tool depends on your goals, budget, and the level of detail you require. Each platform caters to different investor profiles, offering distinct advantages.
| Tool | Data Frequency | Asset Types Covered | Charting Capabilities | Best For | Pricing Range |
|---|---|---|---|---|---|
| ETF.com Fund Flows Tool | Daily, weekly, monthly | ETFs across all sectors | Basic visualization | Individual investors, ETF-focused strategies | Free basic access |
| Bloomberg Terminal | Real-time, daily | All asset classes globally | Advanced charting with 60+ indicators | Professional traders, institutional investors | $31,980/year per terminal |
| Morningstar Direct | Monthly, some daily | Mutual funds, ETFs, alternatives | Professional-grade charts | Asset managers, research analysts | Custom enterprise pricing |
| EPFR Global | Daily, weekly | Global funds across all regions | Advanced analytics dashboard | Institutional investors, fund managers | Custom institutional pricing |
| FactSet Fund Flows | Real-time, daily | Comprehensive global coverage | Integrated with FactSet analytics | Large financial institutions | Custom enterprise pricing |
| Lipper Fund Flows (Refinitiv) | Daily, weekly, monthly | Global mutual funds and ETFs | Professional charting tools | Asset managers, financial advisors | Subscription-based pricing |
| ICI Fund Flow Data | Weekly (Wednesdays) | U.S. mutual funds (98% coverage) | Interactive visualization tool | Market researchers, industry analysts | Free public access |
The table above outlines key features of each tool, but understanding how these features align with specific needs can help narrow your choice.
Data Frequency and Coverage
The frequency of updates varies widely. For those needing real-time insights, Bloomberg Terminal and FactSet are ideal, offering constant updates for active traders. On the other hand, tools like ETF.com focus on daily updates for ETF-specific strategies, while ICI Fund Flow Data delivers weekly insights, covering nearly all U.S. mutual funds.
Pricing and Accessibility
Pricing is another key factor. Free options like ICI Fund Flow Data and ETF.com are great for initial research or individual investors. In contrast, platforms like Bloomberg Terminal cater to institutional users, with a hefty annual price tag of $31,980. Enterprise tools such as Morningstar Direct, EPFR Global, and FactSet offer custom pricing based on your organization's needs.
Best Fit for Different Users
- Individual Investors and Advisors: Tools like ETF.com and ICI Fund Flow Data are user-friendly and cost-effective, making them ideal for basic research.
- Asset Managers and Analysts: Platforms such as Morningstar Direct and FactSet provide advanced analytics and professional-grade charts, perfect for in-depth analysis.
- Institutional Investors: For those managing global portfolios, EPFR Global offers comprehensive fund coverage and analytics tailored to institutional needs.
Integration and Usability
If your workflow relies heavily on tools like Excel, prioritize platforms with seamless data export options. For firms already using Bloomberg systems, the Bloomberg Terminal provides additional fund flow capabilities that integrate smoothly. Smaller firms, however, may find standalone tools like ETF.com or ICI more practical.
Ease of use also varies. ICI Fund Flow Data offers an intuitive visualization tool, making it accessible for beginners. In contrast, the Bloomberg Terminal has a steep learning curve but compensates with its extensive feature set. ETF.com strikes a balance, offering a straightforward interface with solid analytical capabilities.
Conclusion
When choosing a fund flow tool, focus on one that matches your specific needs and investment strategy.
For individual investors, starting with resources like ICI Fund Flow Data or ETF.com can provide solid insights without the need for premium subscriptions. On the other hand, managing complex portfolios may require more advanced tools like Morningstar Direct or FactSet for a deeper level of analysis.
Professional traders and institutional investors often rely on real-time data to make critical decisions. Premium platforms like Bloomberg Terminal or FactSet deliver this level of immediacy and depth, making them invaluable despite their higher costs.
Pay attention to metrics that align with how you work - whether it's asset allocation, fee structures, or performance tracking. For instance, if you're already using Bloomberg, its integrated fund flow features can enhance your workflow.
To get the most out of fund flow analysis, combine it with fundamental and technical research. This approach can help refine your investment signals and provide a more comprehensive view of market opportunities.
For further exploration, check out the Best Investing Tools Directory (https://bestinvestingtools.com), which reviews a variety of platforms for charting, technical analysis, and more.
Ultimately, pick a tool that fits your current needs while offering the flexibility to grow alongside your investment strategy.
FAQs
What should I consider when deciding between free and paid fund flow tools?
When choosing between free and paid fund flow tools, it’s important to match your choice with your specific goals and requirements. Free tools work well for basic tracking or casual use, but if you're looking for real-time data, advanced analytics, or customization options, paid tools are often the better fit - especially for professional or more detailed analysis.
Other key factors to weigh include the quality of customer support, compatibility with other financial platforms, and how regularly the tool is updated. Paid tools generally offer more dependable support and frequent updates, which can be critical for making timely, well-informed investment decisions.
How do daily fund flow updates benefit investors in tracking market trends?
Daily updates from fund flow tools provide investors with up-to-the-minute insights into how markets are behaving. These updates help track changes in liquidity and investor sentiment, making it easier to pinpoint trends as they develop and make decisions based on solid, timely information.
Keeping a close eye on short-term market movements can help investors manage risks more effectively and tweak their strategies to take advantage of emerging opportunities. These tools are especially useful for observing activity in specific market sectors, identifying where money is flowing in or out, and understanding the broader movement of funds within the market.
How do visualization and reporting features in fund flow tools improve investment decisions?
Visualization and Reporting Features in Fund Flow Tools
Fund flow tools equipped with visualization and reporting features take the complexity out of financial data. They transform dense numbers into clear visuals, making it easier to spot trends, recognize patterns, and identify potential risks - all at a glance. This clarity helps investors make decisions with greater confidence.
By turning raw data into actionable insights, these tools streamline the analysis process, saving time and improving accuracy. Whether you're evaluating market opportunities or reviewing portfolio performance, effective data visualization can elevate your investment strategy and help you stay ahead.