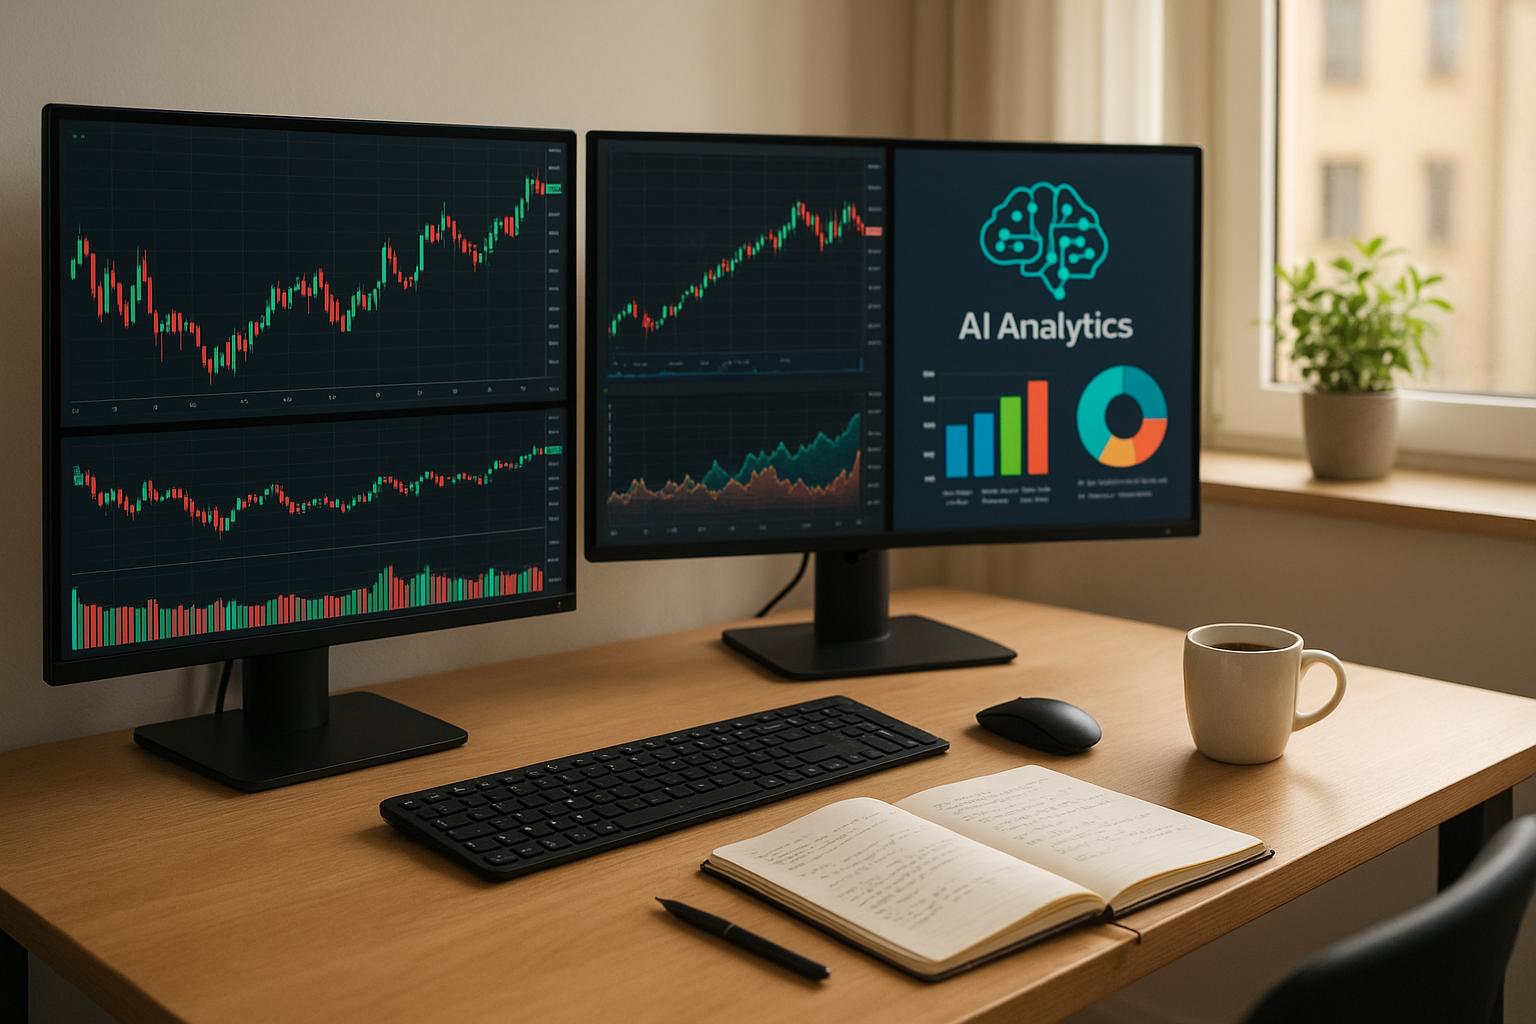
Real-time data dashboards are transforming how investors make decisions by providing up-to-the-second insights on market trends, portfolio performance, and opportunities. Here's why they matter and how they work:
- What They Are: Tools that integrate live data from various sources (stocks, bonds, crypto, etc.) into one interface, eliminating delays from traditional reports.
- Why They’re Important: They help investors act quickly in fast-changing markets, manage risks, and track performance, increasing the likelihood of achieving financial goals by 25%.
- Key Features: Customizable visuals (charts, filters), real-time alerts, integration with brokerage accounts, and predictive analytics for smarter decisions.
- How to Get Started: Define your investment goals, choose a reliable platform, and test your dashboard for accuracy and responsiveness.
In 2025, real-time dashboards are no longer optional - they’re essential for staying ahead in investing. Ready to build yours? Let’s dive in.
Build a Real Time Stock Price Dashboard in Python (with Streamlit)
Key Features of Effective Real-Time Dashboards
Not all dashboards are created equal. The best real-time dashboards for investors go beyond just displaying data - they transform raw numbers into actionable insights. These features are essential for navigating the fast-moving world of investments.
Data Display Options
A great dashboard offers a variety of visualization tools, from classic charts to advanced options like anomaly detection and map-based visuals. For example:
- Line charts track price movements over time.
- Pie charts break down portfolio allocations.
- Bar charts compare performance across assets.
- Gantt charts help with timeline analysis.
- Waterfall charts make it easy to assess returns.
These tools cater to different analytical needs, ensuring that investors can interpret data effectively.
Interactive features like cross-filters, drill-throughs, and adjustable parameters let users explore data dynamically. This means you can zoom into specific metrics without losing sight of the overall picture.
Take Fidelity's Trading Dashboard as an example. It allows users to customize layouts, charting tools, and data columns in their watchlists and portfolios. It also provides advanced charting options with technical indicators like VWAP, Bollinger Bands®, and moving averages. This level of flexibility empowers traders to analyze markets in ways that suit their strategies.
Conditional formatting is another must-have. Visual cues like color changes or highlights instantly draw attention to critical data points, such as a stock hitting its target price or dropping below a stop-loss level. This ensures you won’t miss important signals.
Lastly, simplicity is key. Overly complex displays can slow down decision-making - something you can’t afford in volatile markets. Clear, intuitive visuals paired with real-time data integration make all the difference.
Data Sources and Integration
A dashboard is only as good as the data it receives. Real-time integration ensures you’re working with the freshest, most actionable information available. The best dashboards pull data from multiple sources - brokerage accounts, news feeds, economic calendars, and more - into one centralized platform. This eliminates the hassle of switching between tools and provides a unified view of market conditions and portfolio performance.
Integration also breaks down data silos, making it easier to connect the dots across different systems. For instance, a 2024 study revealed that businesses leveraging real-time data achieved 97% higher profit margins and 62% greater revenue growth compared to their peers. Clearly, having up-to-date information is a game-changer.
Real-time pipelines not only stream data but also validate and clean it, ensuring accuracy. Companies have seen tangible results from this approach: one boosted conversion rates by 20% by tracking website traffic and sales metrics, while another improved productivity by 15% through real-time monitoring of production efficiency.
"Real-time data integration enables users to extract insights from data with minimal delay - typically within a few milliseconds." - IBM
Given that the average enterprise uses nearly 1,200 cloud applications and the global datasphere is projected to hit 393.9 zettabytes by 2028, dashboards must handle vast amounts of data while delivering clear, actionable insights. Integration ensures accuracy, while customization makes the data relevant to individual strategies.
Customization and Filtering Features
Every investor has unique goals, risk tolerance, and strategies. That’s why customization is critical. Dashboards should allow users to tailor their setup - integrating specific data sources, tracking key performance indicators (KPIs), and focusing on metrics that directly align with their financial objectives.
The importance of customization is clear: 68% of enterprises have increased investments in data visualization tools over the past two years, and 72% report faster access to insights thanks to modern visualization technologies.
Filtering options are equally important. Whether you’re sorting by asset class, time period, region, or performance metrics, filters help you zero in on the most relevant data without overwhelming the dashboard. This ensures that decision-makers can act on information that’s directly tied to their roles.
Dashboards also offer options to adjust layouts, color schemes, alert thresholds, and notification preferences. This adaptability ensures the tool fits seamlessly into your workflow rather than forcing you to adapt your process.
"Customizable dashboards enhance decision-making by providing real-time, relevant data tailored to specific roles, improving visibility and understanding of key metrics." - Mussarat Nosheen, Analytico Digital
Today, over 42% of companies are using advanced dashboard technologies to improve product and service quality. This growing adoption highlights the competitive edge that comes from having the right information presented in the right way, exactly when it’s needed.
To stay effective, dashboards should evolve alongside user needs. Feedback loops and regular updates ensure that the tool remains relevant, adapting to changing market conditions and investment strategies. As your approach matures, your dashboard should grow with you, continuing to deliver value.
How to Build a Real-Time Dashboard
Creating a real-time dashboard requires aligning it with your investment goals, choosing the right technology, and ensuring data accuracy before putting it to use.
Setting Investment Goals and Metrics
The first step is to identify the metrics that align with your investment strategy. These key performance indicators (KPIs) will serve as the foundation of your dashboard. Choosing the wrong metrics can lead to poor decision-making, so it’s essential to be precise.
Start by defining your investment objectives. Are you aiming for long-term growth, generating income, or capitalizing on short-term trading opportunities? For growth-focused strategies, metrics like revenue growth rates, price-to-earnings ratios, and changes in market capitalization are crucial. Meanwhile, income-oriented investors might prioritize dividend yields, payout ratios, or interest rate trends.
Narrow your focus to 8–12 core KPIs that are critical to your goals. Also, think about how frequently you need updates. For example, day traders may require second-by-second data, while long-term investors might be fine with monthly or quarterly summaries.
Once your metrics are clear, you can move on to selecting the best platform to meet these needs.
Choosing the Right Tools and Platforms
The platform you choose can significantly impact the effectiveness of your dashboard. Options range from free tools to high-end enterprise solutions, depending on your budget and requirements.
For professional-grade solutions, platforms like Bloomberg Terminal - priced at $31,980 per year as of January 2025 - and AlphaSense, which offers a two-week free trial with customizable pricing, provide advanced features. When evaluating platforms, look for the following:
- Reliable and accurate data from trusted sources
- Low latency for real-time updates
- Comprehensive market coverage tailored to your investment focus
- Integration capabilities for connecting with brokerage accounts, accounting tools, and other financial software
In a YouTube demo by Nolan Gouveia, a tool called Quadratic was used to consolidate a multi-account portfolio into a polished dashboard. Impressively, this was accomplished with just three AI-driven prompts and no manual coding. This example highlights how modern tools are making dashboard creation more accessible, even for individual investors.
Testing and Improving Dashboard Accuracy
Once your tools are in place, the next step is to rigorously test your dashboard under real-world conditions. The value of your dashboard depends entirely on the accuracy of its data, so thorough testing is non-negotiable.
Start by cross-checking your data against trusted sources to ensure accuracy. Optimize query performance by filtering data early, indexing tables, and aggregating only the most essential information. For example, an e-commerce company that processed 100,000 clickstream events daily reduced query processing from 200 million rows to just 3 million rows by limiting the dashboard’s scope to the last 30 days. Techniques like applying Time To Live (TTL) settings for time-series data and using materialized views for pre-calculated aggregates can also enhance responsiveness.
Performance testing is another critical step. Observe how your dashboard handles high trading volumes, market openings and closings, or periods of volatility. It should remain both accurate and fast, even under stress.
Finally, gather feedback from trusted advisors, investment club members, or financial professionals to identify missing metrics or confusing layouts. Set up alerts for data anomalies or performance issues to ensure your dashboard stays reliable over time. Continuous monitoring and updates will keep it running smoothly and effectively.
Common Types of Investment Dashboards
Specialized investment dashboards are designed to deliver focused insights, whether you're managing a portfolio, planning taxes, or analyzing market trends. By integrating real-time data, these tools provide clarity and control for investors.
Portfolio Management Dashboards
Portfolio management dashboards act as a central hub, bringing together all your investments - stocks, bonds, real estate, and even cryptocurrencies - into one streamlined view. Instead of juggling multiple accounts, these dashboards simplify oversight, offering a unified interface.
What makes these dashboards invaluable is their ability to provide real-time insights that empower smarter decisions. Studies suggest that investors who regularly monitor their portfolios are 25% more likely to achieve their financial goals.
Modern tools allow users to drill down from a high-level overview to detailed analyses of sectors, asset classes, or individual investments. This flexibility helps you detect trends and address issues early, preventing small missteps from escalating into bigger problems.
For example, Kubera’s balance sheet software connects to various banking, brokerage, and crypto accounts, offering a full financial snapshot. It visualizes how each asset contributes to your net worth while tracking liabilities, making it easier to manage your financial health.
Another standout feature is risk monitoring. These dashboards track your exposure across asset classes and alert you when allocations deviate from your targets, prompting timely rebalancing to maintain your desired risk profile. Additionally, they often integrate tools for tax planning and expense tracking, further simplifying financial management.
Tax and Expense Analysis Dashboards
Tax and expense analysis dashboards transform what’s often a daunting process into clear, actionable insights. These tools help you grasp the tax consequences of your investment decisions and identify strategies to reduce your tax burden.
Take RightCapital, for instance. Its tax planning tools highlight strategies like Roth conversions or tax-loss harvesting, showing their potential benefits through easy-to-understand visuals. For Premium and Platinum users, the ability to upload tax returns adds a deeper layer of analysis, making complex tax planning more approachable.
These dashboards excel in simplifying intricate calculations, offering visual representations that make tax strategies easier to understand. They also track expenses, comparing monthly targets to actual spending, calculating realization percentages, and analyzing patterns. This clarity helps you see how spending habits align with your long-term goals.
Liability management is another key feature. Dashboards monitor debt balances, interest rates, and payment strategies, helping you prioritize high-interest debts and make informed decisions about whether to focus on paying off liabilities or investing.
Market and Options Analysis Dashboards
Market and options analysis dashboards cater to active traders and those who need advanced tools for navigating fast-moving markets. These dashboards provide live pricing, volume data, and technical indicators, helping traders pinpoint optimal entry and exit points.
Options traders, in particular, benefit from features like implied volatility metrics, Greeks, and profit/loss scenarios. Volatility analysis tools display data such as volatility surfaces and term structures, offering historical comparisons and scenario analysis. This information helps traders evaluate how market uncertainty could impact their strategies and adjust accordingly.
For those who thrive on real-time data, these dashboards are essential, delivering the insights needed to respond quickly to market shifts and refine trading strategies.
sbb-itb-2e26d5a
Advanced Features and Best Practices
Real-time dashboards can go beyond basic monitoring. By embracing advanced features, they become powerful tools that support strategic decision-making.
Interactive and Predictive Analytics
Predictive analytics turns past data into actionable forecasts, helping guide investment decisions. Companies using predictive tools are 2.9 times more likely to rank as top performers. The key to success lies in aligning predictive models with clear business goals. Whether you’re estimating portfolio volatility or spotting potential breakout stocks, having well-defined objectives is essential.
Interactive visualizations take it a step further, allowing you to explore trends and uncover hidden patterns. Unlike static charts, these tools let you adjust timeframes, filter by sectors, or drill into individual holdings. This flexibility makes it easier to extract meaningful insights.
"You need your summary level report, and you need your detail level report. And they need to be connected."
– Malisa N., financial analyst
For predictive features to work effectively, data quality is non-negotiable. Start by identifying reliable data sources and ensuring accuracy. Additionally, keep your predictive models updated to reflect changing market conditions, ensuring they remain reliable over time.
These tools set the stage for timely decision-making, especially when paired with smart alerts.
Real-Time Alerts and Notifications
Real-time alerts bridge the gap between insights and action. To avoid being overwhelmed, fine-tune alert frequency so you’re notified of critical market changes without unnecessary noise. Prioritize alerts by severity - major portfolio shifts or significant market events should grab your immediate attention, while less urgent updates can be bundled into summaries.
Customizing alerts with tags, such as by sector or holding size, helps focus on what matters most. Dynamic thresholds, which adapt to deviations from typical behavior, are especially useful for metrics influenced by seasonal patterns or unexpected growth.
A smart routing strategy ensures alerts reach you through the right channels. For instance, urgent notifications might go straight to your phone, medium-priority updates could appear on messaging platforms, and lower-priority alerts can be sent via email.
"Alerts should notify you when there's an important problem with your application. But they shouldn't be too noisy, because that can lead to alert fatigue."
– Sentry.io
Connecting Dashboards with Investment Strategies
When real-time alerts and predictive analytics come together, your dashboard evolves into a key driver of your investment strategy. Instead of generic metrics, configure it to track indicators that directly influence your decisions. Automated alerts for recurring issues free up your time for deeper analysis.
Integrating your dashboard with your investment workflow streamlines processes. For example, linking it with your research tools, tax planning software, and execution platforms eliminates the need for manual data transfers. Features like performance attribution can break down returns by asset class, sector, or time period, helping you identify which parts of your strategy are delivering results.
To keep things running smoothly, technical upgrades ensure that complex calculations - such as risk-adjusted returns or sector exposures - are processed quickly and accurately. Incorporating risk monitoring into your dashboard adds another layer of security. Alerts for concentration breaches or heightened volatility help maintain discipline, especially during turbulent markets.
As your investment strategy evolves, revisit your dashboard configuration regularly to ensure it stays aligned with your goals. With these advanced features in place, your dashboard becomes more than a monitoring tool - it becomes a strategic ally in driving proactive and informed investment decisions.
Conclusion and Next Steps
Summary: Benefits of Real-Time Dashboards
Real-time dashboards provide investors with immediate insights, enabling faster and more informed decision-making. With data updates as frequent as every five seconds, these tools have shown a 20% boost in conversion rates, offering a clear edge in unpredictable markets.
In addition to speed, these dashboards improve operational efficiency by automating data collection and reporting. They also promote trust through greater transparency.
"Real-time dashboards are a game-changing tool that not only showcases your data but also empowers you to make informed decisions, faster." - Ipsos Jarmany Ltd
"In 2025's fast-moving startup ecosystem, investors expect more than periodic updates - they demand real-time financial transparency." - Johnnie Walker, Co-Founder of Rooled
As highlighted, real-time dashboards are more than just monitoring tools - they serve as strategic assets that enhance collaboration, improve risk management, and help you stay ahead of market fluctuations. They empower proactive decision-making and can even identify potential risks before they escalate.
With these advantages in mind, here’s how you can take the next steps toward implementing your own real-time dashboard.
Getting Started with Real-Time Dashboards
Now that the benefits are clear, it’s time to put them into action by setting up your dashboard. You don’t need to overhaul your entire investment process to get started. Focus first on the most critical metrics - portfolio value, performance of key holdings, and relevant market indices - before expanding to additional features.
Start with a user needs analysis. Identify the data that’s most important to you, how often you’ll need updates, and the types of visualizations that best align with your decision-making style. Think of your dashboard as a personalized command center, tailored to guide you through the complexities of financial markets.
When choosing tools and platforms, prioritize ease of use, compatibility with your existing systems, and scalability for future needs. Resources like the Best Investing Tools Directory (https://bestinvestingtools.com) provide in-depth reviews of dashboard platforms, charting tools, and technical analysis software to help you make an informed choice.
Begin with a straightforward, scalable dashboard that can grow with your needs. Ensure your data sources update automatically and enhance performance by caching query results for quicker load times.
Design your dashboard to deliver concise, actionable insights that directly support your investment goals. Regularly review and refine your setup to ensure it continues to align with your evolving objectives. By doing so, you’ll create a tool that doesn’t just track data but actively drives smarter, more strategic investment decisions.
FAQs
How do real-time data dashboards help investors make better decisions compared to traditional reports?
Real-Time Data Dashboards: A Game-Changer for Investors
Real-time data dashboards give investors instant access to up-to-the-minute information, a must-have in today’s fast-paced markets. Unlike static reports that rely on older data, these dashboards let users monitor key metrics and market trends as they unfold. This means investors can act quickly, make smarter decisions, and reduce the lag between spotting an opportunity and seizing it.
What’s more, these dashboards bring unmatched transparency. Investors can keep a close eye on financial performance and operational metrics in real time, staying informed about crucial changes as they happen. This level of visibility strengthens trust and equips investors to make timely, strategic moves in an increasingly competitive landscape.
What should investors look for when choosing a platform to create a real-time investment dashboard?
When selecting a platform to build a real-time investment dashboard, it's crucial to focus on a few standout features that align with your needs. Start with ease of use - the platform should have a straightforward, user-friendly interface. Customizable views are a big plus, as they let you quickly access and interpret the metrics that matter most to you without unnecessary hassle.
Equally important is real-time data integration paired with predictive analytics. This combination enables you to track live performance while also gaining insights into potential future trends. Platforms with clear and dynamic visualizations, like line charts for tracking trends or bar charts for making comparisons, can make even complex data easier to digest.
Lastly, make sure the platform prioritizes data accuracy. Automated validation checks are a must-have for ensuring reliable insights, so you can trust the performance of your dashboard without second-guessing the numbers.
How can investors ensure their real-time dashboards display accurate and reliable data?
To keep your real-time dashboard data accurate and dependable, begin by ensuring your data sources are reliable, current, and consistent. Regular quality checks are crucial to verify the completeness and integrity of your data, laying a solid groundwork for meaningful dashboard insights.
Automating these checks can save time and reduce errors. Using tools that detect anomalies and deliver real-time updates can further improve data accuracy. With these steps in place, you’ll be better equipped to make informed investment decisions backed by trustworthy, up-to-the-minute data.